Locating the Custom Charts & Tables tool
[ Joined After January 2018 ]
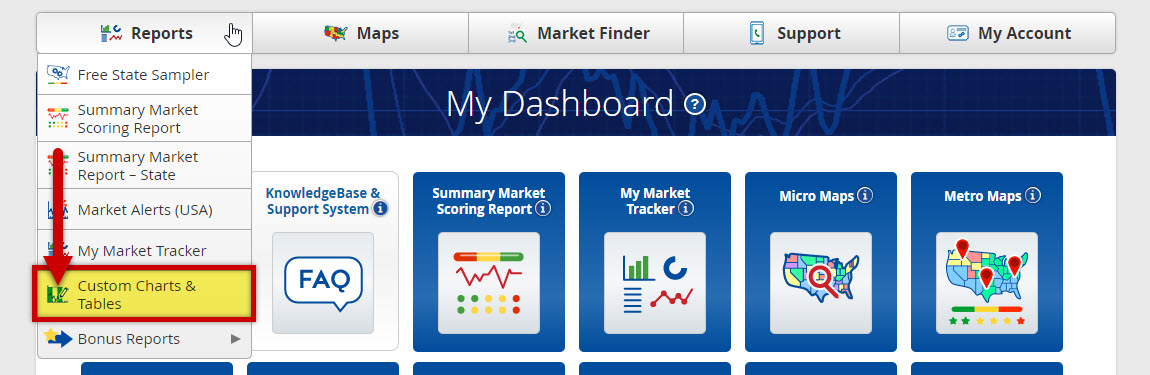
To find the Custom Charts and Tables, simply click on the Reports tab on the menu bar, and select Custom Charts and Tables from the drop-down list.
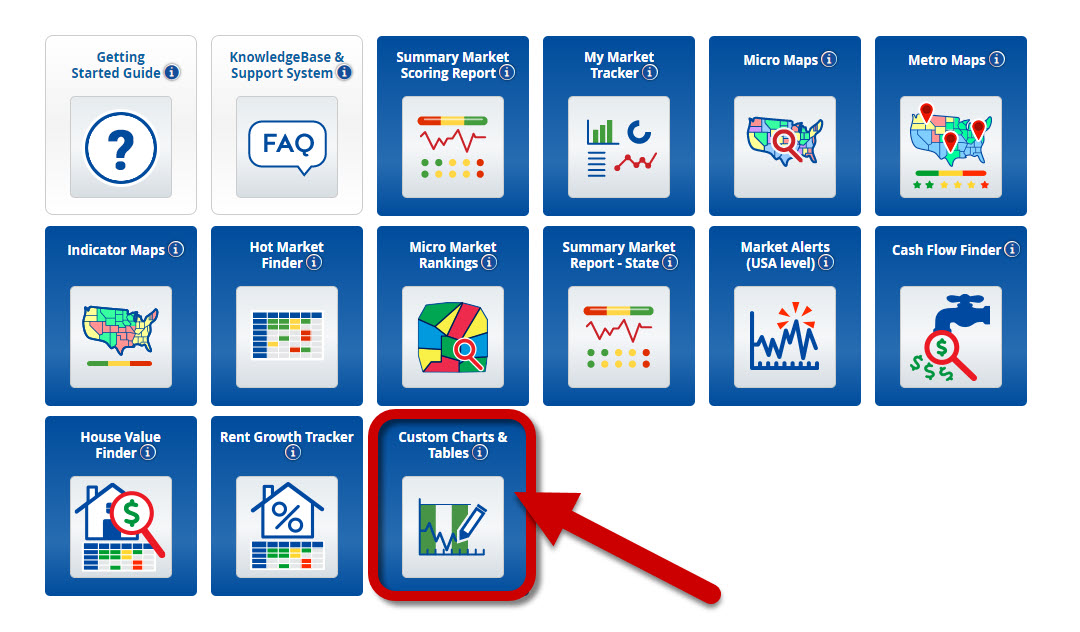
Or, you can locate it in the Dashboard (PRO section).
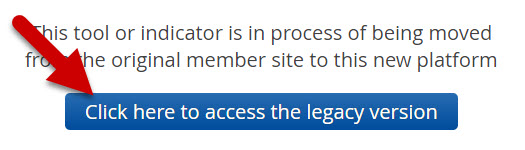
For the next step, to click the blue button, "Click here to access the tool the legacy version".
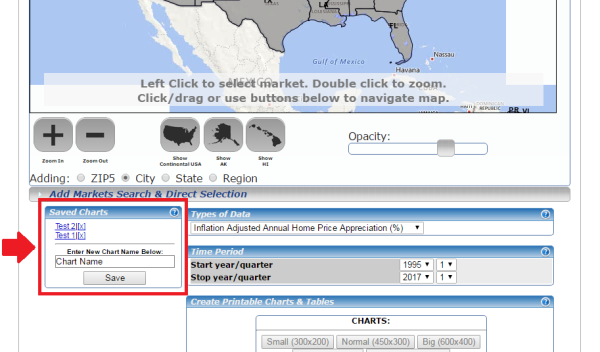
You'll be redirected to the "Create Custom Charts & Tables" page.
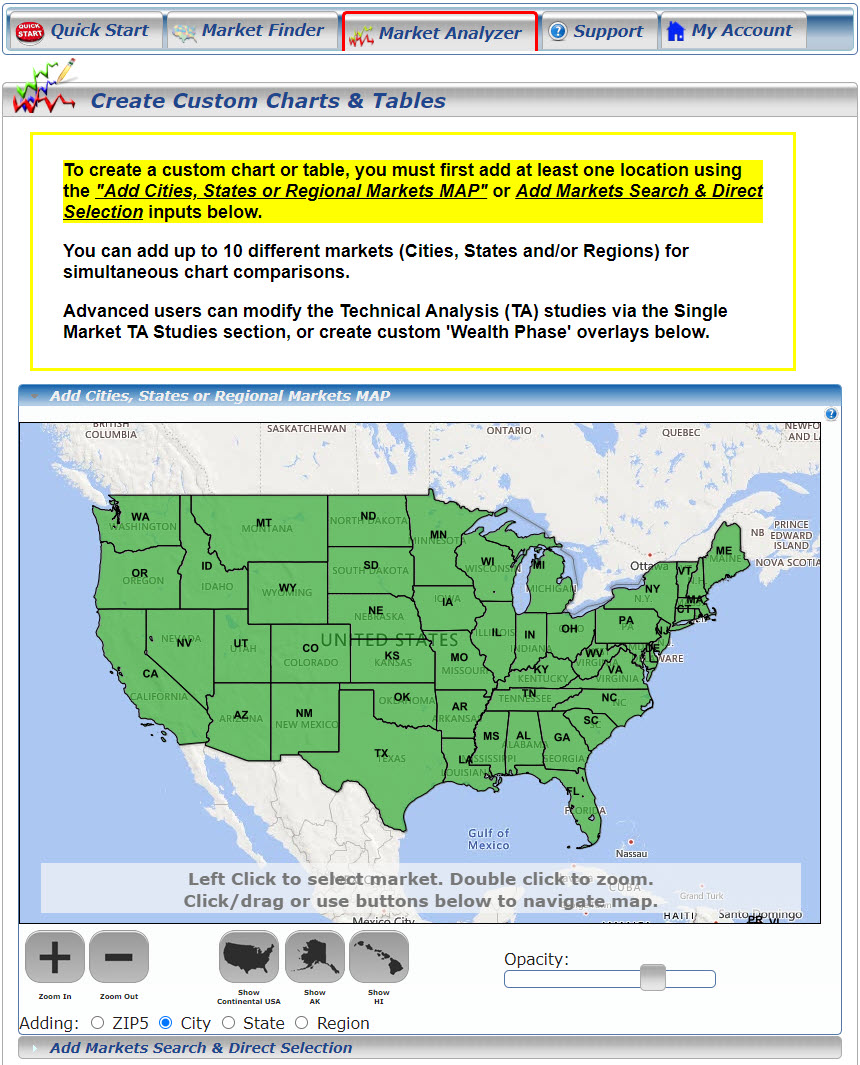
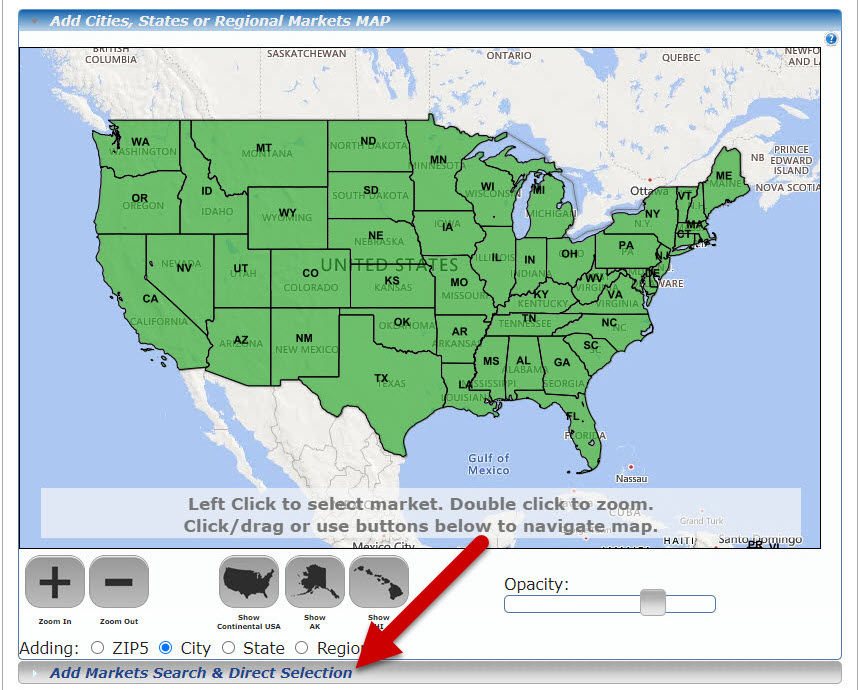
To create a chart, click the gray horizontal box, located below the map, "Add Markets Search & Direct Selection".
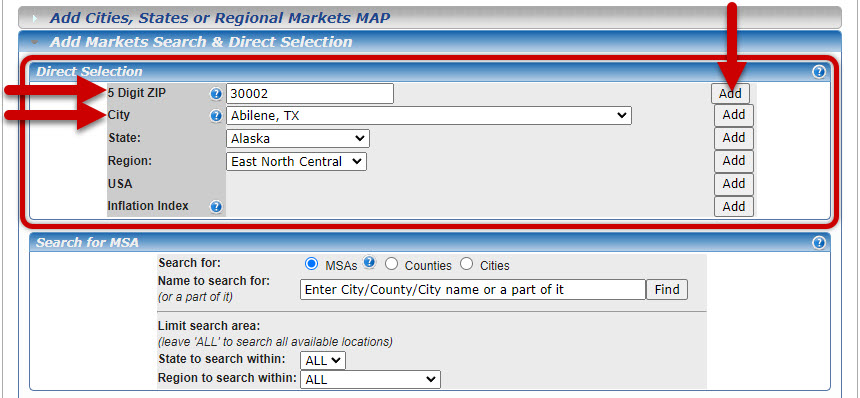
Refer to the "Direct Selection" section to add zip codes or city markets. Simply remove the defaulted zip or city, and add the desired market, then click the "Add" button on the right side. The chart will automatically populate the desired markets.
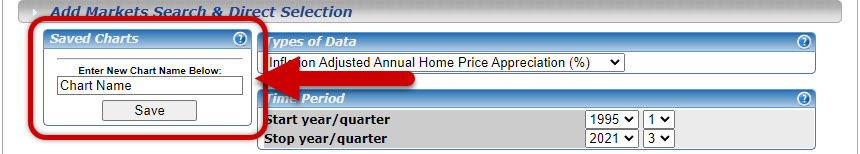
Scroll down to select the type of data and time period for the chart.
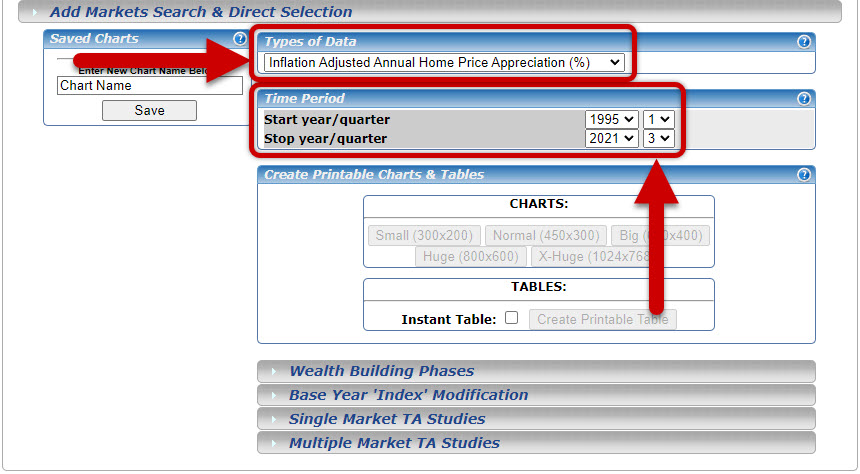
Once you have created a chart, enter a new chart name in the "Saved Charts" section, as outlined in the image below, and then click the "Save" button to save the chart.
To access a saved chart, scroll down to the "Saved Charts" section. Click the name of your saved chart to open.
[ Joined Before January 2018 ]
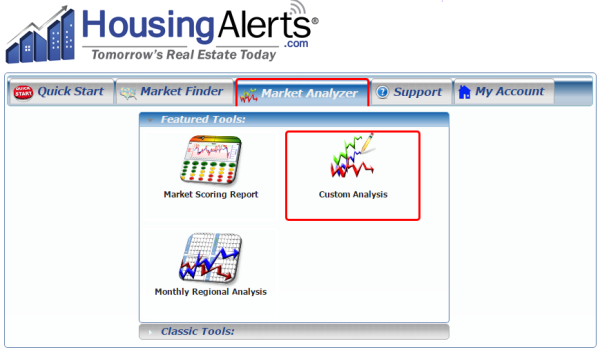
Log in to your HousingAlerts account, click the "Market Analyzer" tab, and then click the"Custom Analysis" icon.
You'll be redirected to the "Create Custom Charts & Tables" page.

Once you have created a chart, enter a new chart name in the "Saved Charts" section, as outlined in the image below, and then click the "Save" button to save the chart.
To access a saved chart, scroll down to the "Saved Charts" section. Click the name of your saved chart to open.