Widgets can display any predetermined Zip Code, County, City or State market and/or markets can be user-selected and/or tied directly into any on-page map, tool or application.


Desktop Placement Samples


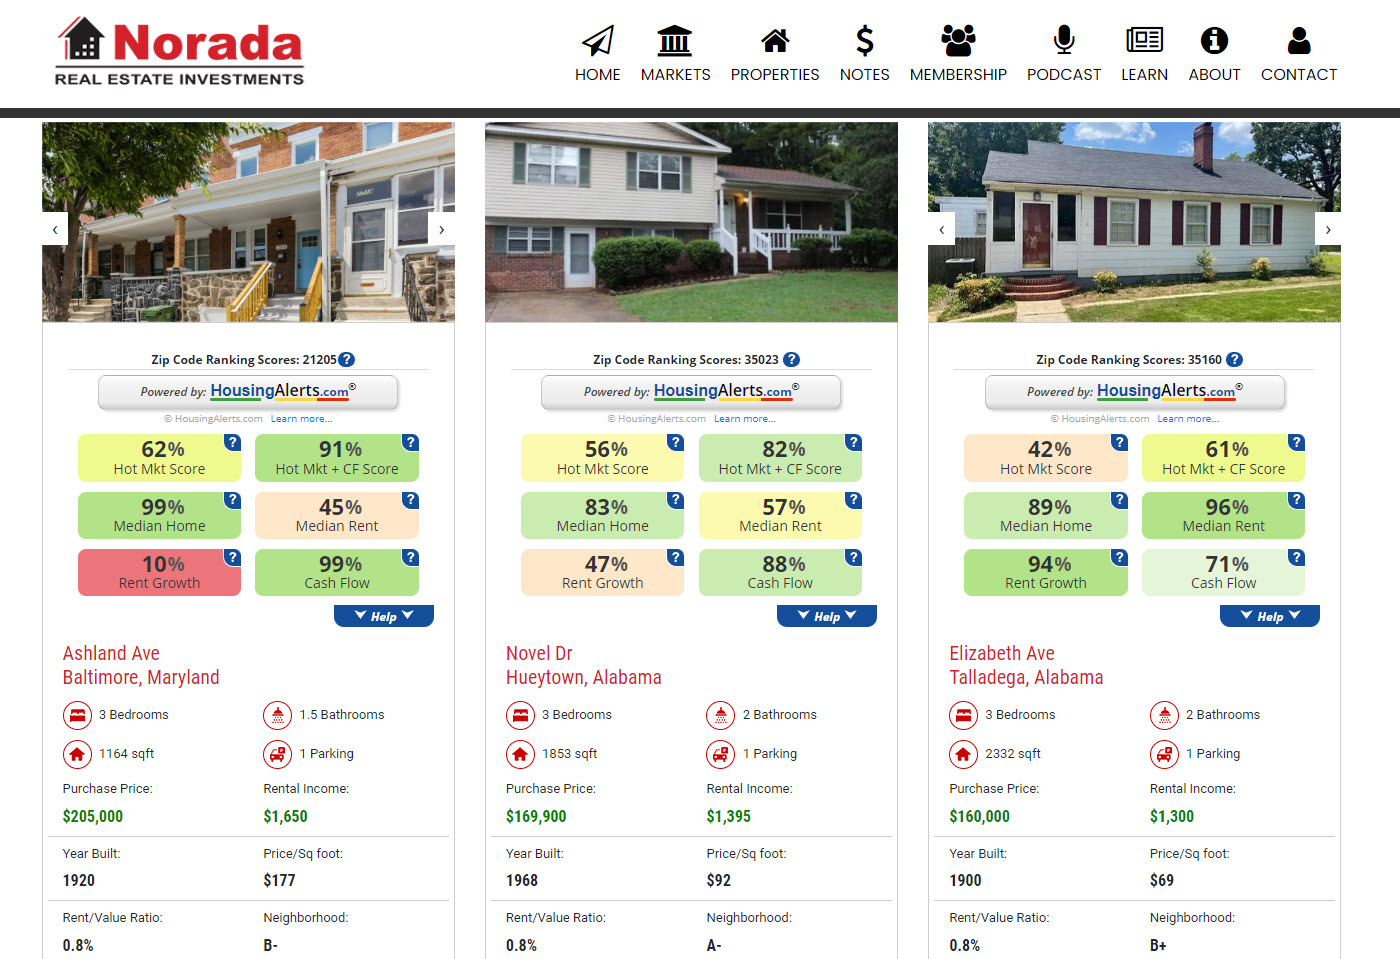
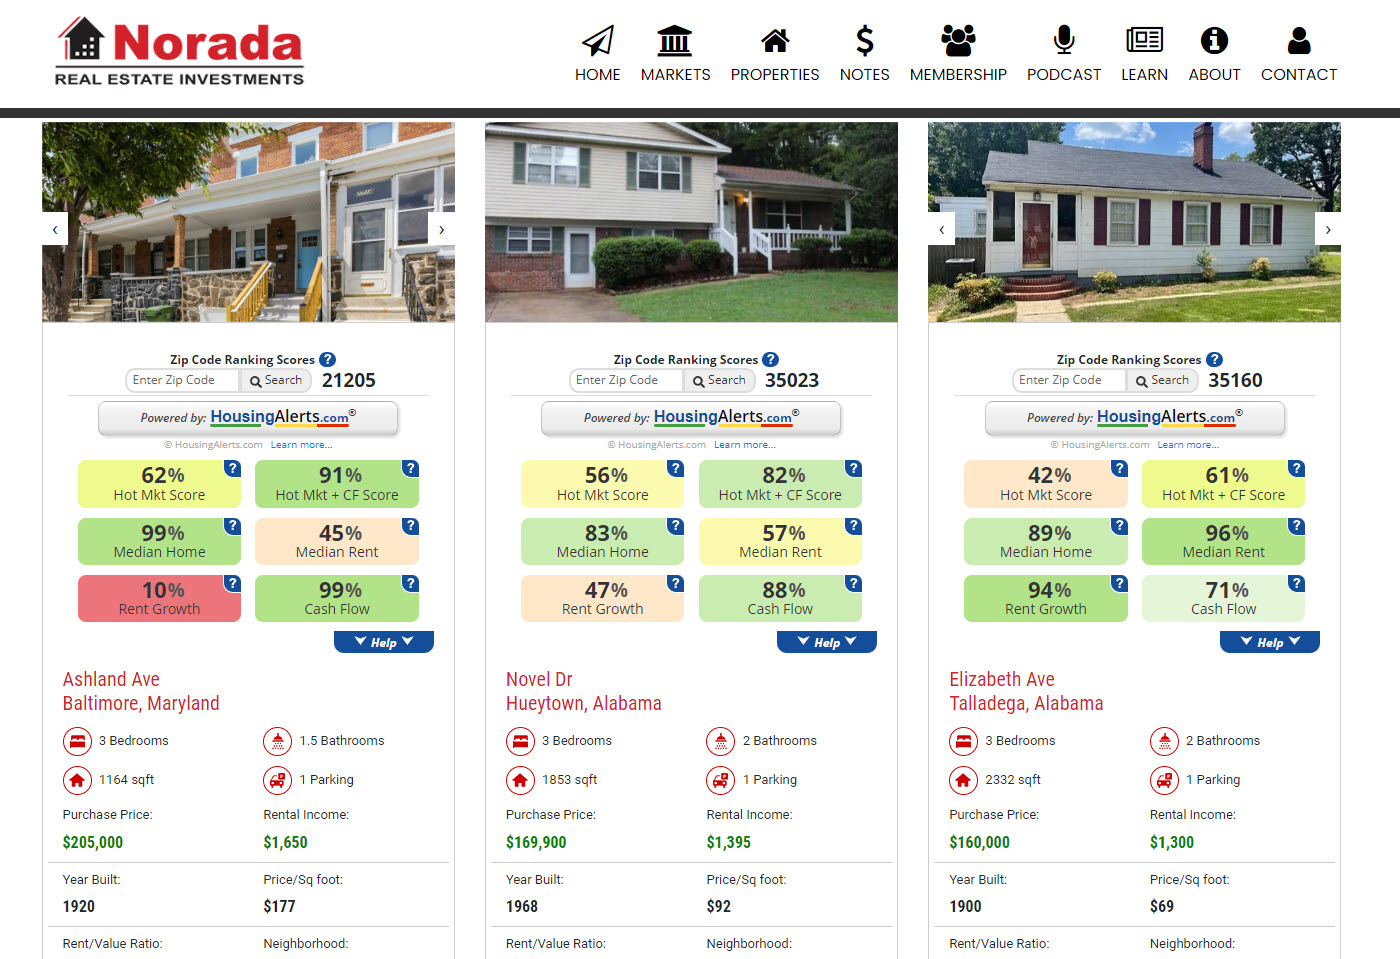
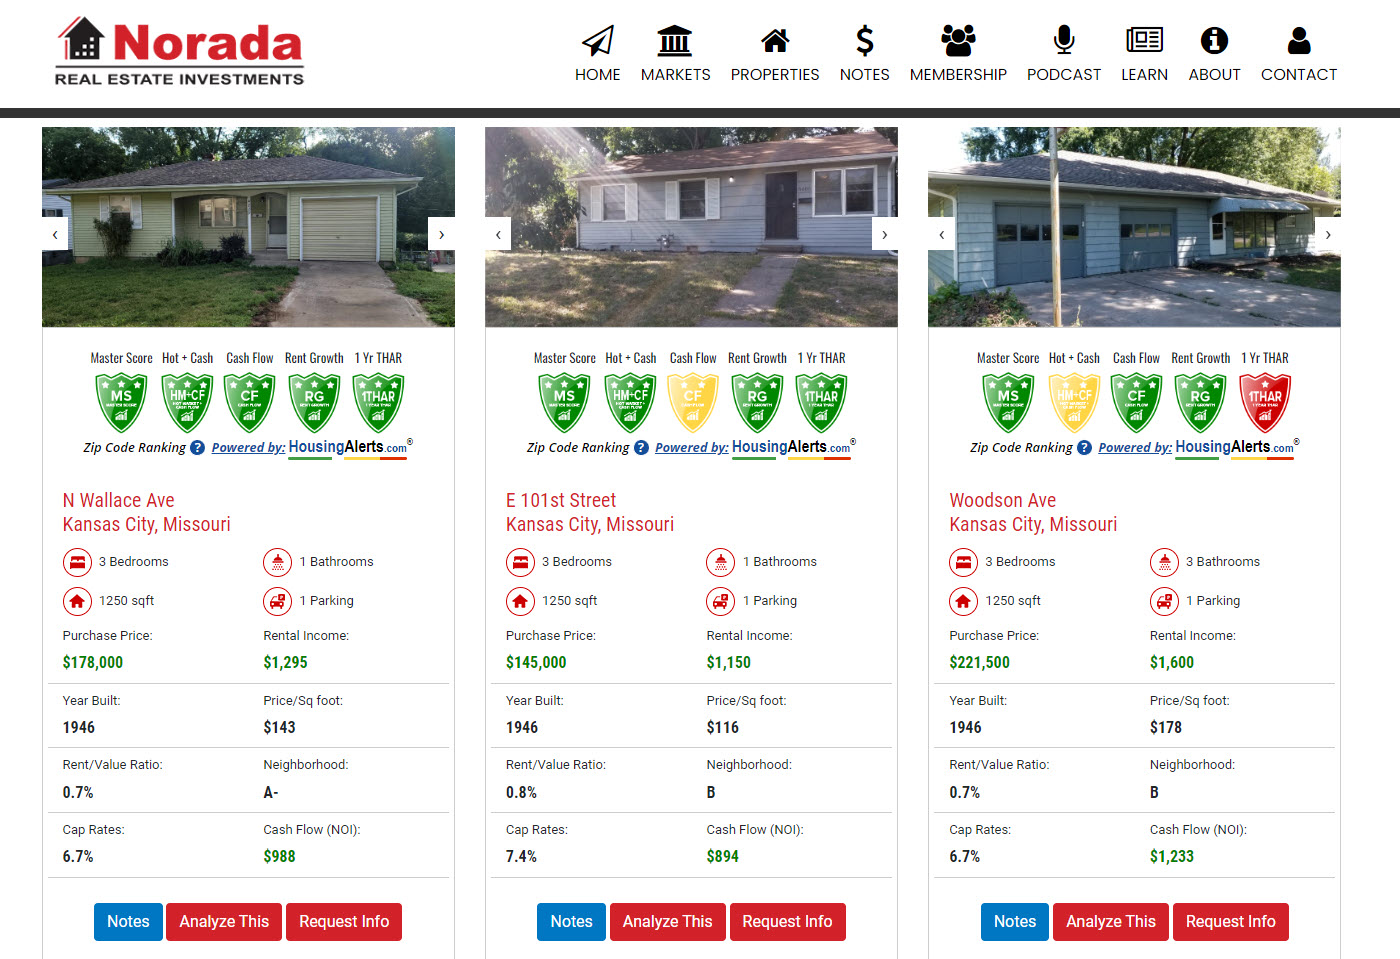
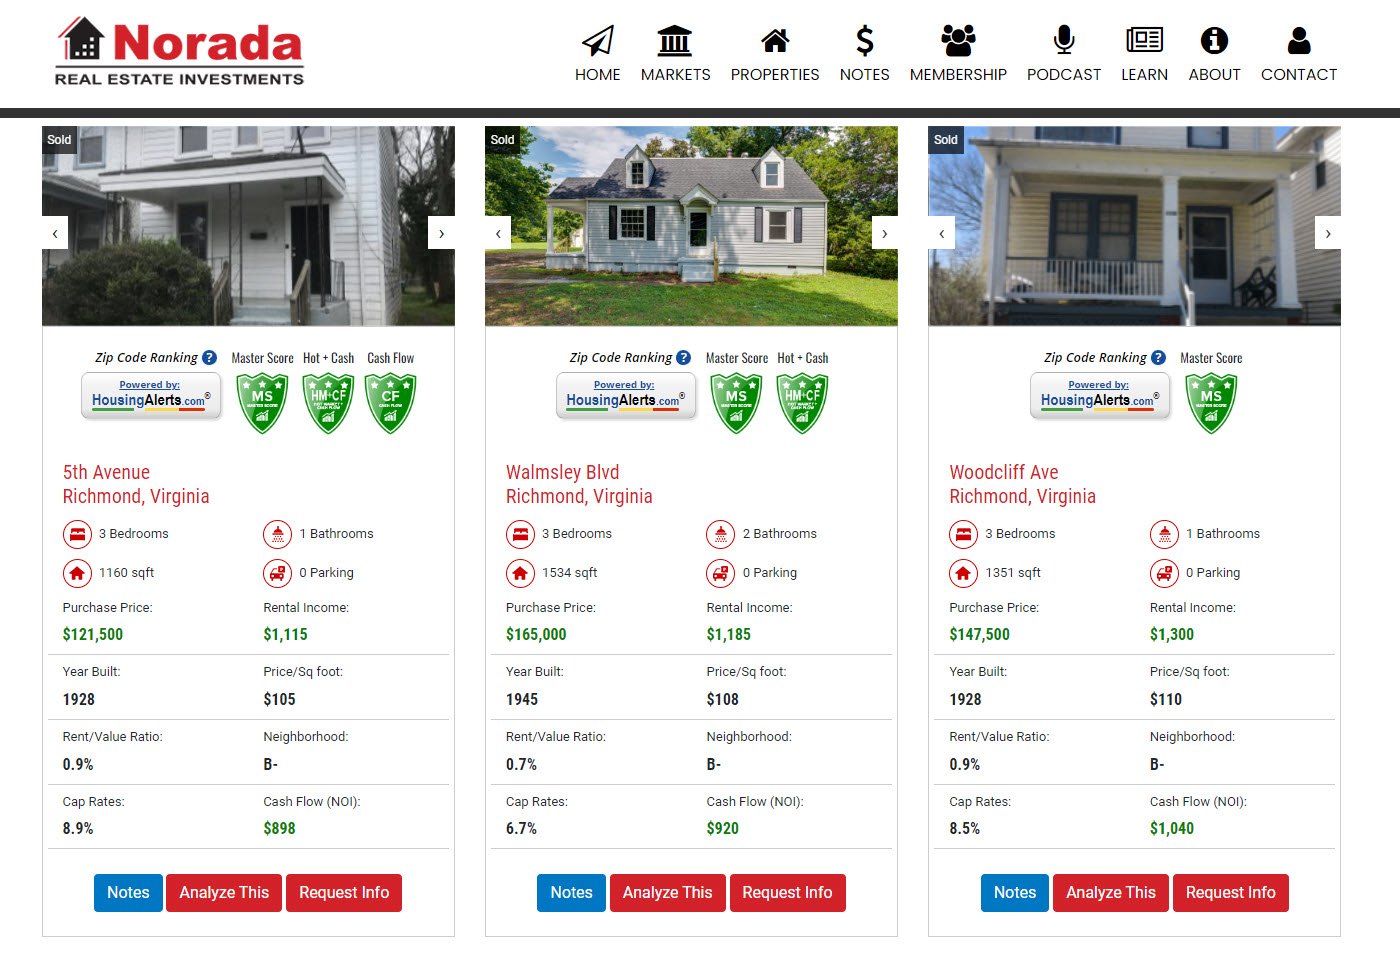
Live Demo - Market Pulse


Loading... Please Wait
Zip Code Ranking Scores

Percentile Ranking Scores

Most market indicators are ranked from strongest ('99') to weakest ('0') on a percentile basis. The score represents that market's RANK compared to all markets nationwide.

Percentile Ranks are useful for measuring RELATIVE performance BETWEEN markets, not for measuring the absolute performance of a market. Use the RAW scores when deciding to enter/exit or price an offer. Use Percentile Rank when choosing between several markets.

The background color indicates it's ranking compared to all such markets on a percentile basis nationwide. Dark green is the 'highest' ranking, dark red is the lowest.

Learn More...

34473

Population Rank

The census accounts for people based on the location of their usual residence, which is the place where they live and sleep most of the time.

Population (raw) Population POP

Population Rank

The census accounts for people based on the location of their usual residence, which is the place where they live and sleep most of the time.

21,424 Population (raw) Population POP

Population Rank

The census accounts for people based on the location of their usual residence, which is the place where they live and sleep most of the time.

Median Home (raw)

This is the estimated median house value of all Single Family Residential (SFR) properties in that market, compared to the median value of all other markets nationwide, ranked on a percentile basis.

Median Home (raw) Median Home MED

Median Home (raw)

This is the estimated median house value of all Single Family Residential (SFR) properties in that market, compared to the median value of all other markets nationwide, ranked on a percentile basis.

$265,606 Median Home (raw) Median Home MED

Median Home (raw)

This is the estimated median house value of all Single Family Residential (SFR) properties in that market, compared to the median value of all other markets nationwide, ranked on a percentile basis.

Median Rent (Raw)

Rental rates for single family homes can vary significantly based on location, size, age, amenities and condition of the property. The amount shown here is the estimated median monthly rental rate across the entire market.

Median Rent (raw) Median Rent MR

Median Rent (Raw)

Rental rates for single family homes can vary significantly based on location, size, age, amenities and condition of the property. The amount shown here is the estimated median monthly rental rate across the entire market.

$2,067 Median Rent (raw) Median Rent MR

Median Rent (Raw)

Rental rates for single family homes can vary significantly based on location, size, age, amenities and condition of the property. The amount shown here is the estimated median monthly rental rate across the entire market.

Rent Growth (raw)

This is the average annual SFR rent growth of the prior 3 years. The background color indicates it's ranking compared to all such markets on a percentile basis nationwide. Dark green is the 'highest' ranking, dark red is the lowest.

Rent Growth (raw) Rent Growth RG

Rent Growth (raw)

This is the average annual SFR rent growth of the prior 3 years. The background color indicates it's ranking compared to all such markets on a percentile basis nationwide. Dark green is the 'highest' ranking, dark red is the lowest.

11.3% Rent Growth (raw) Rent Growth RG

Rent Growth (raw)

This is the average annual SFR rent growth of the prior 3 years. The background color indicates it's ranking compared to all such markets on a percentile basis nationwide. Dark green is the 'highest' ranking, dark red is the lowest.

Cash Flow Score (Raw)

The 'Raw' Cash Flow score is the ANNUAL gross median rent (monthly x 12) for this market divided by the median property value. A higher ratio is likely to generate more cash flow than a lower ratio.

Note: Many factors other than median rent can affect cash flow, including vacancy, repairs, operating expenses, and management.

Cash Flow (raw) Cash Flow CF

Cash Flow Score (Raw)

The 'Raw' Cash Flow score is the ANNUAL gross median rent (monthly x 12) for this market divided by the median property value. A higher ratio is likely to generate more cash flow than a lower ratio.

Note: Many factors other than median rent can affect cash flow, including vacancy, repairs, operating expenses, and management.

9.3 Cash Flow (raw) Cash Flow CF

Cash Flow Score (Raw)

The 'Raw' Cash Flow score is the ANNUAL gross median rent (monthly x 12) for this market divided by the median property value. A higher ratio is likely to generate more cash flow than a lower ratio.

Note: Many factors other than median rent can affect cash flow, including vacancy, repairs, operating expenses, and management.

Close Tab

Matching your investing tactics and strategies to your local real estate market trends produces more deals with less risk, effort, and capital. Your micro market intelligence finds and targets those needle-in-a-haystack opportunities and dramatically increases your ROI while slashing your upfront acquisition and marketing costs. Learn more...

Help
Loading... Please Wait
Zip Code Ranking Scores

Percentile Ranking Scores

Most market indicators are ranked from strongest ('99') to weakest ('0') on a percentile basis. The score represents that market's RANK compared to all markets nationwide.

Percentile Ranks are useful for measuring RELATIVE performance BETWEEN markets, not for measuring the absolute performance of a market. Use the RAW scores when deciding to enter/exit or price an offer. Use Percentile Rank when choosing between several markets.

The background color indicates it's ranking compared to all such markets on a percentile basis nationwide. Dark green is the 'highest' ranking, dark red is the lowest.

Learn More...

34473

Hot Market Score

The Hot Market Score RANK uses proprietary algorithms to score and rank each market relative to all other markets nationwide on a scale of 0 to 99 (99 = strongest, most vibrant).

It combines the TAPS, STAR and other indicators into a single score and is the best single indicator (if you only want to look at ONE scoring element) to compare any market against all other markets.

Hot Market Score Rank (pct) Hot Mkt Score HMS

Hot Market Score

The Hot Market Score RANK uses proprietary algorithms to score and rank each market relative to all other markets nationwide on a scale of 0 to 99 (99 = strongest, most vibrant).

It combines the TAPS, STAR and other indicators into a single score and is the best single indicator (if you only want to look at ONE scoring element) to compare any market against all other markets.

83% Hot Market Score Rank (pct) Hot Mkt Score HMS

Hot Market Score

The Hot Market Score RANK uses proprietary algorithms to score and rank each market relative to all other markets nationwide on a scale of 0 to 99 (99 = strongest, most vibrant).

It combines the TAPS, STAR and other indicators into a single score and is the best single indicator (if you only want to look at ONE scoring element) to compare any market against all other markets.

Hot Market + Cash Flow Score (Percentile)

This indicator combines a micro-market's cash flow potential AND its potential for appreciation. The combined score is expressed as a Percentile from '0' (weakest) to '99' (strongest). For example, a score of '93' means THAT micro market scored higher (stronger) than 93% of all similar U.S. micro markets.

Hot Market + Cash Flow Score (pct) Hot Mkt + CF Score HMCF

Hot Market + Cash Flow Score (Percentile)

This indicator combines a micro-market's cash flow potential AND its potential for appreciation. The combined score is expressed as a Percentile from '0' (weakest) to '99' (strongest). For example, a score of '93' means THAT micro market scored higher (stronger) than 93% of all similar U.S. micro markets.

87% Hot Market + Cash Flow Score (pct) Hot Mkt + CF Score HMCF

Hot Market + Cash Flow Score (Percentile)

This indicator combines a micro-market's cash flow potential AND its potential for appreciation. The combined score is expressed as a Percentile from '0' (weakest) to '99' (strongest). For example, a score of '93' means THAT micro market scored higher (stronger) than 93% of all similar U.S. micro markets.

Median Home

This is the estimated median house value of all Single Family Residential (SFR) properties in that market, compared to the median value of all other markets nationwide, ranked on a percentile basis. Highest priced homes are assigned the lowest percentile scores; the highest score (99) indicates the lowest median home values nationwide.

Median Home (pct) Median Home MED

Median Home

This is the estimated median house value of all Single Family Residential (SFR) properties in that market, compared to the median value of all other markets nationwide, ranked on a percentile basis. Highest priced homes are assigned the lowest percentile scores; the highest score (99) indicates the lowest median home values nationwide.

44% Median Home (pct) Median Home MED

Median Home

This is the estimated median house value of all Single Family Residential (SFR) properties in that market, compared to the median value of all other markets nationwide, ranked on a percentile basis. Highest priced homes are assigned the lowest percentile scores; the highest score (99) indicates the lowest median home values nationwide.

Median Rent (pct)

Rental rates for single family homes can vary significantly based on location, size, age, amenities and condition of the property. The percentile score shown here is the relative ranking of this zip code's median monthly rent compared to all other zip codes nationwide.

Percentile scores range from 0 to 99; the higher the score, the higher the median rent relative to all other zip codes.

Median Rent (pct) Median Rent MR

Median Rent (pct)

Rental rates for single family homes can vary significantly based on location, size, age, amenities and condition of the property. The percentile score shown here is the relative ranking of this zip code's median monthly rent compared to all other zip codes nationwide.

Percentile scores range from 0 to 99; the higher the score, the higher the median rent relative to all other zip codes.

25% Median Rent (pct) Median Rent MR

Median Rent (pct)

Rental rates for single family homes can vary significantly based on location, size, age, amenities and condition of the property. The percentile score shown here is the relative ranking of this zip code's median monthly rent compared to all other zip codes nationwide.

Percentile scores range from 0 to 99; the higher the score, the higher the median rent relative to all other zip codes.

Rent Growth

A high percentile score (99 is highest) score means SFR rent rates have been increasing more in this market, RELATIVE to all markets nationwide.

Rent Growth (pct) Rent Growth RG

Rent Growth

A high percentile score (99 is highest) score means SFR rent rates have been increasing more in this market, RELATIVE to all markets nationwide.

61% Rent Growth (pct) Rent Growth RG

Rent Growth

A high percentile score (99 is highest) score means SFR rent rates have been increasing more in this market, RELATIVE to all markets nationwide.

Cash Flow Score (Percentile)

The Cash Flow Ranking score is determined by dividing this zip code's median rent by its median home value, then ranking that score relative to all other zip codes nationwide on a scale of 0 to 99. The higher the percentile score the greater the likelihood of positive cash flow.

Note: Many factors other than median rent can affect cash flow, including vacancy, repairs, operating expenses, and management.

Cash Flow (pct) Cash Flow CF

Cash Flow Score (Percentile)

The Cash Flow Ranking score is determined by dividing this zip code's median rent by its median home value, then ranking that score relative to all other zip codes nationwide on a scale of 0 to 99. The higher the percentile score the greater the likelihood of positive cash flow.

Note: Many factors other than median rent can affect cash flow, including vacancy, repairs, operating expenses, and management.

72% Cash Flow (pct) Cash Flow CF

Cash Flow Score (Percentile)

The Cash Flow Ranking score is determined by dividing this zip code's median rent by its median home value, then ranking that score relative to all other zip codes nationwide on a scale of 0 to 99. The higher the percentile score the greater the likelihood of positive cash flow.

Note: Many factors other than median rent can affect cash flow, including vacancy, repairs, operating expenses, and management.

Close Tab

Matching your investing tactics and strategies to your local real estate market trends produces more deals with less risk, effort, and capital. Your micro market intelligence finds and targets those needle-in-a-haystack opportunities and dramatically increases your ROI while slashing your upfront acquisition and marketing costs. Learn more...

Help
Loading... Please Wait
Zip Code Ranking Scores For: 34473

Percentile Ranking Scores

Most market indicators are ranked from strongest ('99') to weakest ('0') on a percentile basis. The score represents that market's RANK compared to all markets nationwide.

Percentile Ranks are useful for measuring RELATIVE performance BETWEEN markets, not for measuring the absolute performance of a market. Use the RAW scores when deciding to enter/exit or price an offer. Use Percentile Rank when choosing between several markets.

The background color indicates it's ranking compared to all such markets on a percentile basis nationwide. Dark green is the 'highest' ranking, dark red is the lowest.

Learn More...

Population Rank

The census accounts for people based on the location of their usual residence, which is the place where they live and sleep most of the time.

Population (raw) Population POP

Population Rank

The census accounts for people based on the location of their usual residence, which is the place where they live and sleep most of the time.

21,424 Population (raw) Population POP

Population Rank

The census accounts for people based on the location of their usual residence, which is the place where they live and sleep most of the time.

Median Home (raw)

This is the estimated median house value of all Single Family Residential (SFR) properties in that market, compared to the median value of all other markets nationwide, ranked on a percentile basis.

Median Home (raw) Median Home MED

Median Home (raw)

This is the estimated median house value of all Single Family Residential (SFR) properties in that market, compared to the median value of all other markets nationwide, ranked on a percentile basis.

$265,606 Median Home (raw) Median Home MED

Median Home (raw)

This is the estimated median house value of all Single Family Residential (SFR) properties in that market, compared to the median value of all other markets nationwide, ranked on a percentile basis.

Median Rent (Raw)

Rental rates for single family homes can vary significantly based on location, size, age, amenities and condition of the property. The amount shown here is the estimated median monthly rental rate across the entire market.

Median Rent (raw) Median Rent MR

Median Rent (Raw)

Rental rates for single family homes can vary significantly based on location, size, age, amenities and condition of the property. The amount shown here is the estimated median monthly rental rate across the entire market.

$2,067 Median Rent (raw) Median Rent MR

Median Rent (Raw)

Rental rates for single family homes can vary significantly based on location, size, age, amenities and condition of the property. The amount shown here is the estimated median monthly rental rate across the entire market.

Rent Growth (raw)

This is the average annual SFR rent growth of the prior 3 years. The background color indicates it's ranking compared to all such markets on a percentile basis nationwide. Dark green is the 'highest' ranking, dark red is the lowest.

Rent Growth (raw) Rent Growth RG

Rent Growth (raw)

This is the average annual SFR rent growth of the prior 3 years. The background color indicates it's ranking compared to all such markets on a percentile basis nationwide. Dark green is the 'highest' ranking, dark red is the lowest.

11.3% Rent Growth (raw) Rent Growth RG

Rent Growth (raw)

This is the average annual SFR rent growth of the prior 3 years. The background color indicates it's ranking compared to all such markets on a percentile basis nationwide. Dark green is the 'highest' ranking, dark red is the lowest.

Cash Flow Score (Raw)

The 'Raw' Cash Flow score is the ANNUAL gross median rent (monthly x 12) for this market divided by the median property value. A higher ratio is likely to generate more cash flow than a lower ratio.

Note: Many factors other than median rent can affect cash flow, including vacancy, repairs, operating expenses, and management.

Cash Flow (raw) Cash Flow CF

Cash Flow Score (Raw)

The 'Raw' Cash Flow score is the ANNUAL gross median rent (monthly x 12) for this market divided by the median property value. A higher ratio is likely to generate more cash flow than a lower ratio.

Note: Many factors other than median rent can affect cash flow, including vacancy, repairs, operating expenses, and management.

9.3 Cash Flow (raw) Cash Flow CF

Cash Flow Score (Raw)

The 'Raw' Cash Flow score is the ANNUAL gross median rent (monthly x 12) for this market divided by the median property value. A higher ratio is likely to generate more cash flow than a lower ratio.

Note: Many factors other than median rent can affect cash flow, including vacancy, repairs, operating expenses, and management.

Close Tab

Matching your investing tactics and strategies to your local real estate market trends produces more deals with less risk, effort, and capital. Your micro market intelligence finds and targets those needle-in-a-haystack opportunities and dramatically increases your ROI while slashing your upfront acquisition and marketing costs. Learn more...

Help
Loading... Please Wait
Zip Code Ranking Scores For: 34473

Percentile Ranking Scores

Most market indicators are ranked from strongest ('99') to weakest ('0') on a percentile basis. The score represents that market's RANK compared to all markets nationwide.

Percentile Ranks are useful for measuring RELATIVE performance BETWEEN markets, not for measuring the absolute performance of a market. Use the RAW scores when deciding to enter/exit or price an offer. Use Percentile Rank when choosing between several markets.

The background color indicates it's ranking compared to all such markets on a percentile basis nationwide. Dark green is the 'highest' ranking, dark red is the lowest.

Learn More...

Hot Market Score

The Hot Market Score RANK uses proprietary algorithms to score and rank each market relative to all other markets nationwide on a scale of 0 to 99 (99 = strongest, most vibrant).

It combines the TAPS, STAR and other indicators into a single score and is the best single indicator (if you only want to look at ONE scoring element) to compare any market against all other markets.

Hot Market Score Rank (pct) Hot Mkt Score HMS

Hot Market Score

The Hot Market Score RANK uses proprietary algorithms to score and rank each market relative to all other markets nationwide on a scale of 0 to 99 (99 = strongest, most vibrant).

It combines the TAPS, STAR and other indicators into a single score and is the best single indicator (if you only want to look at ONE scoring element) to compare any market against all other markets.

83% Hot Market Score Rank (pct) Hot Mkt Score HMS

Hot Market Score

The Hot Market Score RANK uses proprietary algorithms to score and rank each market relative to all other markets nationwide on a scale of 0 to 99 (99 = strongest, most vibrant).

It combines the TAPS, STAR and other indicators into a single score and is the best single indicator (if you only want to look at ONE scoring element) to compare any market against all other markets.

Hot Market + Cash Flow Score (Percentile)

This indicator combines a micro-market's cash flow potential AND its potential for appreciation. The combined score is expressed as a Percentile from '0' (weakest) to '99' (strongest). For example, a score of '93' means THAT micro market scored higher (stronger) than 93% of all similar U.S. micro markets.

Hot Market + Cash Flow Score (pct) Hot Mkt + CF Score HMCF

Hot Market + Cash Flow Score (Percentile)

This indicator combines a micro-market's cash flow potential AND its potential for appreciation. The combined score is expressed as a Percentile from '0' (weakest) to '99' (strongest). For example, a score of '93' means THAT micro market scored higher (stronger) than 93% of all similar U.S. micro markets.

87% Hot Market + Cash Flow Score (pct) Hot Mkt + CF Score HMCF

Hot Market + Cash Flow Score (Percentile)

This indicator combines a micro-market's cash flow potential AND its potential for appreciation. The combined score is expressed as a Percentile from '0' (weakest) to '99' (strongest). For example, a score of '93' means THAT micro market scored higher (stronger) than 93% of all similar U.S. micro markets.

Median Home

This is the estimated median house value of all Single Family Residential (SFR) properties in that market, compared to the median value of all other markets nationwide, ranked on a percentile basis. Highest priced homes are assigned the lowest percentile scores; the highest score (99) indicates the lowest median home values nationwide.

Median Home (pct) Median Home MED

Median Home

This is the estimated median house value of all Single Family Residential (SFR) properties in that market, compared to the median value of all other markets nationwide, ranked on a percentile basis. Highest priced homes are assigned the lowest percentile scores; the highest score (99) indicates the lowest median home values nationwide.

44% Median Home (pct) Median Home MED

Median Home

This is the estimated median house value of all Single Family Residential (SFR) properties in that market, compared to the median value of all other markets nationwide, ranked on a percentile basis. Highest priced homes are assigned the lowest percentile scores; the highest score (99) indicates the lowest median home values nationwide.

Median Rent (pct)

Rental rates for single family homes can vary significantly based on location, size, age, amenities and condition of the property. The percentile score shown here is the relative ranking of this zip code's median monthly rent compared to all other zip codes nationwide.

Percentile scores range from 0 to 99; the higher the score, the higher the median rent relative to all other zip codes.

Median Rent (pct) Median Rent MR

Median Rent (pct)

Rental rates for single family homes can vary significantly based on location, size, age, amenities and condition of the property. The percentile score shown here is the relative ranking of this zip code's median monthly rent compared to all other zip codes nationwide.

Percentile scores range from 0 to 99; the higher the score, the higher the median rent relative to all other zip codes.

25% Median Rent (pct) Median Rent MR

Median Rent (pct)

Rental rates for single family homes can vary significantly based on location, size, age, amenities and condition of the property. The percentile score shown here is the relative ranking of this zip code's median monthly rent compared to all other zip codes nationwide.

Percentile scores range from 0 to 99; the higher the score, the higher the median rent relative to all other zip codes.

Rent Growth

A high percentile score (99 is highest) score means SFR rent rates have been increasing more in this market, RELATIVE to all markets nationwide.

Rent Growth (pct) Rent Growth RG

Rent Growth

A high percentile score (99 is highest) score means SFR rent rates have been increasing more in this market, RELATIVE to all markets nationwide.

61% Rent Growth (pct) Rent Growth RG

Rent Growth

A high percentile score (99 is highest) score means SFR rent rates have been increasing more in this market, RELATIVE to all markets nationwide.

Cash Flow Score (Percentile)

The Cash Flow Ranking score is determined by dividing this zip code's median rent by its median home value, then ranking that score relative to all other zip codes nationwide on a scale of 0 to 99. The higher the percentile score the greater the likelihood of positive cash flow.

Note: Many factors other than median rent can affect cash flow, including vacancy, repairs, operating expenses, and management.

Cash Flow (pct) Cash Flow CF

Cash Flow Score (Percentile)

The Cash Flow Ranking score is determined by dividing this zip code's median rent by its median home value, then ranking that score relative to all other zip codes nationwide on a scale of 0 to 99. The higher the percentile score the greater the likelihood of positive cash flow.

Note: Many factors other than median rent can affect cash flow, including vacancy, repairs, operating expenses, and management.

72% Cash Flow (pct) Cash Flow CF

Cash Flow Score (Percentile)

The Cash Flow Ranking score is determined by dividing this zip code's median rent by its median home value, then ranking that score relative to all other zip codes nationwide on a scale of 0 to 99. The higher the percentile score the greater the likelihood of positive cash flow.

Note: Many factors other than median rent can affect cash flow, including vacancy, repairs, operating expenses, and management.

Close Tab

Matching your investing tactics and strategies to your local real estate market trends produces more deals with less risk, effort, and capital. Your micro market intelligence finds and targets those needle-in-a-haystack opportunities and dramatically increases your ROI while slashing your upfront acquisition and marketing costs. Learn more...

Help
Loading... Please Wait
Zip Code Ranking Scores For: 34473

Percentile Ranking Scores

Most market indicators are ranked from strongest ('99') to weakest ('0') on a percentile basis. The score represents that market's RANK compared to all markets nationwide.

Percentile Ranks are useful for measuring RELATIVE performance BETWEEN markets, not for measuring the absolute performance of a market. Use the RAW scores when deciding to enter/exit or price an offer. Use Percentile Rank when choosing between several markets.

The background color indicates it's ranking compared to all such markets on a percentile basis nationwide. Dark green is the 'highest' ranking, dark red is the lowest.

Learn More...

Population Rank

The census accounts for people based on the location of their usual residence, which is the place where they live and sleep most of the time.

Population (raw) Population POP

Population Rank

The census accounts for people based on the location of their usual residence, which is the place where they live and sleep most of the time.

21,424 Population (raw) Population POP

Population Rank

The census accounts for people based on the location of their usual residence, which is the place where they live and sleep most of the time.

Median Home (raw)

This is the estimated median house value of all Single Family Residential (SFR) properties in that market, compared to the median value of all other markets nationwide, ranked on a percentile basis.

Median Home (raw) Median Home MED

Median Home (raw)

This is the estimated median house value of all Single Family Residential (SFR) properties in that market, compared to the median value of all other markets nationwide, ranked on a percentile basis.

$265,606 Median Home (raw) Median Home MED

Median Home (raw)

This is the estimated median house value of all Single Family Residential (SFR) properties in that market, compared to the median value of all other markets nationwide, ranked on a percentile basis.

Median Rent (Raw)

Rental rates for single family homes can vary significantly based on location, size, age, amenities and condition of the property. The amount shown here is the estimated median monthly rental rate across the entire market.

Median Rent (raw) Median Rent MR

Median Rent (Raw)

Rental rates for single family homes can vary significantly based on location, size, age, amenities and condition of the property. The amount shown here is the estimated median monthly rental rate across the entire market.

$2,067 Median Rent (raw) Median Rent MR

Median Rent (Raw)

Rental rates for single family homes can vary significantly based on location, size, age, amenities and condition of the property. The amount shown here is the estimated median monthly rental rate across the entire market.

Rent Growth (raw)

This is the average annual SFR rent growth of the prior 3 years. The background color indicates it's ranking compared to all such markets on a percentile basis nationwide. Dark green is the 'highest' ranking, dark red is the lowest.

Rent Growth (raw) Rent Growth RG

Rent Growth (raw)

This is the average annual SFR rent growth of the prior 3 years. The background color indicates it's ranking compared to all such markets on a percentile basis nationwide. Dark green is the 'highest' ranking, dark red is the lowest.

11.3% Rent Growth (raw) Rent Growth RG

Rent Growth (raw)

This is the average annual SFR rent growth of the prior 3 years. The background color indicates it's ranking compared to all such markets on a percentile basis nationwide. Dark green is the 'highest' ranking, dark red is the lowest.

Cash Flow Score (Raw)

The 'Raw' Cash Flow score is the ANNUAL gross median rent (monthly x 12) for this market divided by the median property value. A higher ratio is likely to generate more cash flow than a lower ratio.

Note: Many factors other than median rent can affect cash flow, including vacancy, repairs, operating expenses, and management.

Cash Flow (raw) Cash Flow CF

Cash Flow Score (Raw)

The 'Raw' Cash Flow score is the ANNUAL gross median rent (monthly x 12) for this market divided by the median property value. A higher ratio is likely to generate more cash flow than a lower ratio.

Note: Many factors other than median rent can affect cash flow, including vacancy, repairs, operating expenses, and management.

9.3 Cash Flow (raw) Cash Flow CF

Cash Flow Score (Raw)

The 'Raw' Cash Flow score is the ANNUAL gross median rent (monthly x 12) for this market divided by the median property value. A higher ratio is likely to generate more cash flow than a lower ratio.

Note: Many factors other than median rent can affect cash flow, including vacancy, repairs, operating expenses, and management.

Details
Close Tab

Matching your investing tactics and strategies to your local real estate market trends produces more deals with less risk, effort, and capital. Your micro market intelligence finds and targets those needle-in-a-haystack opportunities and dramatically increases your ROI while slashing your upfront acquisition and marketing costs. Learn more...

Help
Loading... Please Wait
Zip Code Ranking Scores For: 34473

Percentile Ranking Scores

Most market indicators are ranked from strongest ('99') to weakest ('0') on a percentile basis. The score represents that market's RANK compared to all markets nationwide.

Percentile Ranks are useful for measuring RELATIVE performance BETWEEN markets, not for measuring the absolute performance of a market. Use the RAW scores when deciding to enter/exit or price an offer. Use Percentile Rank when choosing between several markets.

The background color indicates it's ranking compared to all such markets on a percentile basis nationwide. Dark green is the 'highest' ranking, dark red is the lowest.

Learn More...

Hot Market Score

The Hot Market Score RANK uses proprietary algorithms to score and rank each market relative to all other markets nationwide on a scale of 0 to 99 (99 = strongest, most vibrant).

It combines the TAPS, STAR and other indicators into a single score and is the best single indicator (if you only want to look at ONE scoring element) to compare any market against all other markets.

Hot Market Score Rank (pct) Hot Mkt Score HMS

Hot Market Score

The Hot Market Score RANK uses proprietary algorithms to score and rank each market relative to all other markets nationwide on a scale of 0 to 99 (99 = strongest, most vibrant).

It combines the TAPS, STAR and other indicators into a single score and is the best single indicator (if you only want to look at ONE scoring element) to compare any market against all other markets.

83% Hot Market Score Rank (pct) Hot Mkt Score HMS

Hot Market Score

The Hot Market Score RANK uses proprietary algorithms to score and rank each market relative to all other markets nationwide on a scale of 0 to 99 (99 = strongest, most vibrant).

It combines the TAPS, STAR and other indicators into a single score and is the best single indicator (if you only want to look at ONE scoring element) to compare any market against all other markets.

Hot Market + Cash Flow Score (Percentile)

This indicator combines a micro-market's cash flow potential AND its potential for appreciation. The combined score is expressed as a Percentile from '0' (weakest) to '99' (strongest). For example, a score of '93' means THAT micro market scored higher (stronger) than 93% of all similar U.S. micro markets.

Hot Market + Cash Flow Score (pct) Hot Mkt + CF Score HMCF

Hot Market + Cash Flow Score (Percentile)

This indicator combines a micro-market's cash flow potential AND its potential for appreciation. The combined score is expressed as a Percentile from '0' (weakest) to '99' (strongest). For example, a score of '93' means THAT micro market scored higher (stronger) than 93% of all similar U.S. micro markets.

87% Hot Market + Cash Flow Score (pct) Hot Mkt + CF Score HMCF

Hot Market + Cash Flow Score (Percentile)

This indicator combines a micro-market's cash flow potential AND its potential for appreciation. The combined score is expressed as a Percentile from '0' (weakest) to '99' (strongest). For example, a score of '93' means THAT micro market scored higher (stronger) than 93% of all similar U.S. micro markets.

Median Home

This is the estimated median house value of all Single Family Residential (SFR) properties in that market, compared to the median value of all other markets nationwide, ranked on a percentile basis. Highest priced homes are assigned the lowest percentile scores; the highest score (99) indicates the lowest median home values nationwide.

Median Home (pct) Median Home MED

Median Home

This is the estimated median house value of all Single Family Residential (SFR) properties in that market, compared to the median value of all other markets nationwide, ranked on a percentile basis. Highest priced homes are assigned the lowest percentile scores; the highest score (99) indicates the lowest median home values nationwide.

44% Median Home (pct) Median Home MED

Median Home

This is the estimated median house value of all Single Family Residential (SFR) properties in that market, compared to the median value of all other markets nationwide, ranked on a percentile basis. Highest priced homes are assigned the lowest percentile scores; the highest score (99) indicates the lowest median home values nationwide.

Median Rent (pct)

Rental rates for single family homes can vary significantly based on location, size, age, amenities and condition of the property. The percentile score shown here is the relative ranking of this zip code's median monthly rent compared to all other zip codes nationwide.

Percentile scores range from 0 to 99; the higher the score, the higher the median rent relative to all other zip codes.

Median Rent (pct) Median Rent MR

Median Rent (pct)

Rental rates for single family homes can vary significantly based on location, size, age, amenities and condition of the property. The percentile score shown here is the relative ranking of this zip code's median monthly rent compared to all other zip codes nationwide.

Percentile scores range from 0 to 99; the higher the score, the higher the median rent relative to all other zip codes.

25% Median Rent (pct) Median Rent MR

Median Rent (pct)

Rental rates for single family homes can vary significantly based on location, size, age, amenities and condition of the property. The percentile score shown here is the relative ranking of this zip code's median monthly rent compared to all other zip codes nationwide.

Percentile scores range from 0 to 99; the higher the score, the higher the median rent relative to all other zip codes.

Rent Growth

A high percentile score (99 is highest) score means SFR rent rates have been increasing more in this market, RELATIVE to all markets nationwide.

Rent Growth (pct) Rent Growth RG

Rent Growth

A high percentile score (99 is highest) score means SFR rent rates have been increasing more in this market, RELATIVE to all markets nationwide.

61% Rent Growth (pct) Rent Growth RG

Rent Growth

A high percentile score (99 is highest) score means SFR rent rates have been increasing more in this market, RELATIVE to all markets nationwide.

Cash Flow Score (Percentile)

The Cash Flow Ranking score is determined by dividing this zip code's median rent by its median home value, then ranking that score relative to all other zip codes nationwide on a scale of 0 to 99. The higher the percentile score the greater the likelihood of positive cash flow.

Note: Many factors other than median rent can affect cash flow, including vacancy, repairs, operating expenses, and management.

Cash Flow (pct) Cash Flow CF

Cash Flow Score (Percentile)

The Cash Flow Ranking score is determined by dividing this zip code's median rent by its median home value, then ranking that score relative to all other zip codes nationwide on a scale of 0 to 99. The higher the percentile score the greater the likelihood of positive cash flow.

Note: Many factors other than median rent can affect cash flow, including vacancy, repairs, operating expenses, and management.

72% Cash Flow (pct) Cash Flow CF

Cash Flow Score (Percentile)

The Cash Flow Ranking score is determined by dividing this zip code's median rent by its median home value, then ranking that score relative to all other zip codes nationwide on a scale of 0 to 99. The higher the percentile score the greater the likelihood of positive cash flow.

Note: Many factors other than median rent can affect cash flow, including vacancy, repairs, operating expenses, and management.

Details
Close Tab

Matching your investing tactics and strategies to your local real estate market trends produces more deals with less risk, effort, and capital. Your micro market intelligence finds and targets those needle-in-a-haystack opportunities and dramatically increases your ROI while slashing your upfront acquisition and marketing costs. Learn more...

Help
+
Perfect! We've reserved your spot:
T

Now, just enter your email below,
and we'll send you your invitation.

We take privacy seriously and we hate SPAM too!