
Summary: See whether a market is in its "money window": when you can make the most with the least effort, capital and risk.
On the chart: in any Smart Market Report, click the Wealth Phase tab.
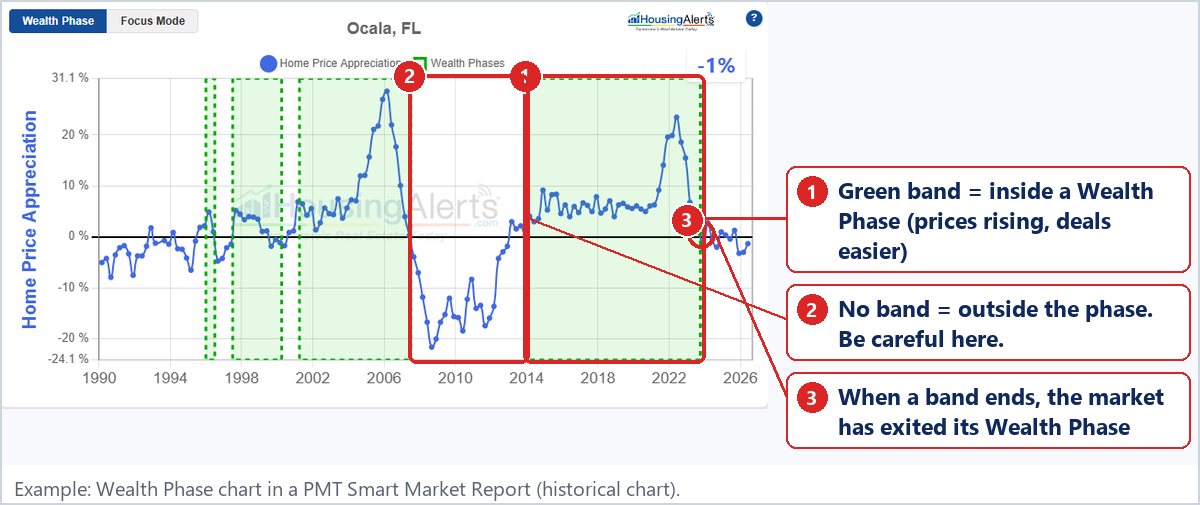
- Green band: the market is inside a Wealth Phase.
- No band: outside the phase.
- Band ends: the market has exited its Wealth Phase.
On the map: pick Wealth Phase in the indicator menu.
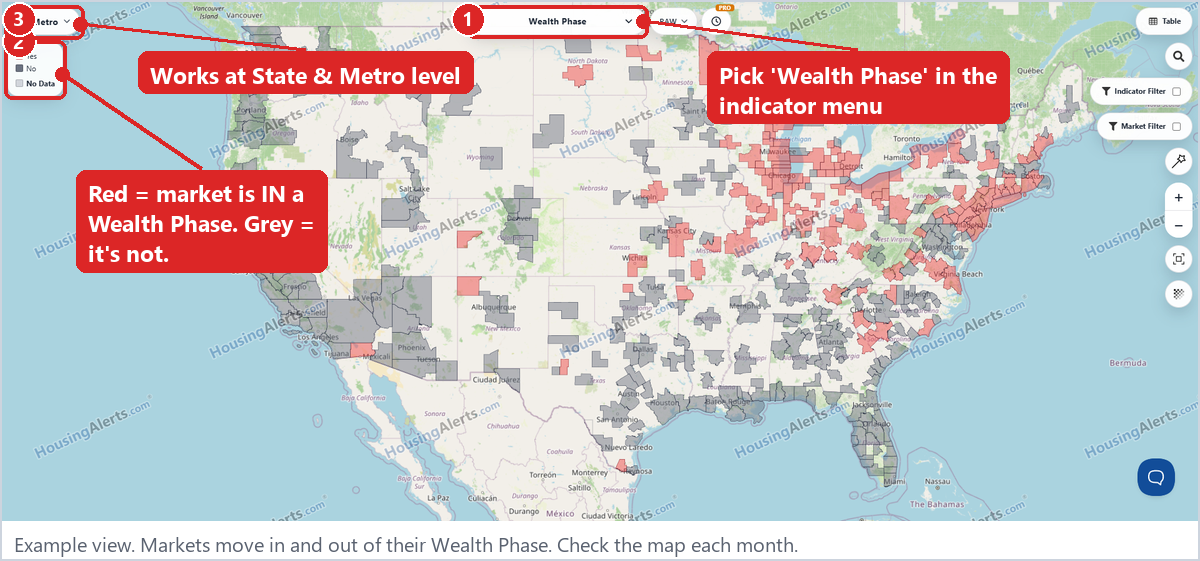
Note: Wealth Phase is calculated at the State and Metro level. For counties and ZIP codes, use the parent metro's Wealth Phase as your guide.