
Summary: The MLS data refreshes monthly. This routine turns that into an early-warning habit.
The routine
- Open your bookmarked Smart Market Report and glance at the four vital signs.
- If something looks different, click "1 y" on that tile to see the 10-year trend.
- Open the Table, filtered to your state (with a population minimum).
- Sort by YoY % Chng on Months Inventory and on % Of Listings w/ Price Drop.
- Note the micro markets and indicators that changed significantly. Put them on your 'watch list' and check again next month.
Shortcuts
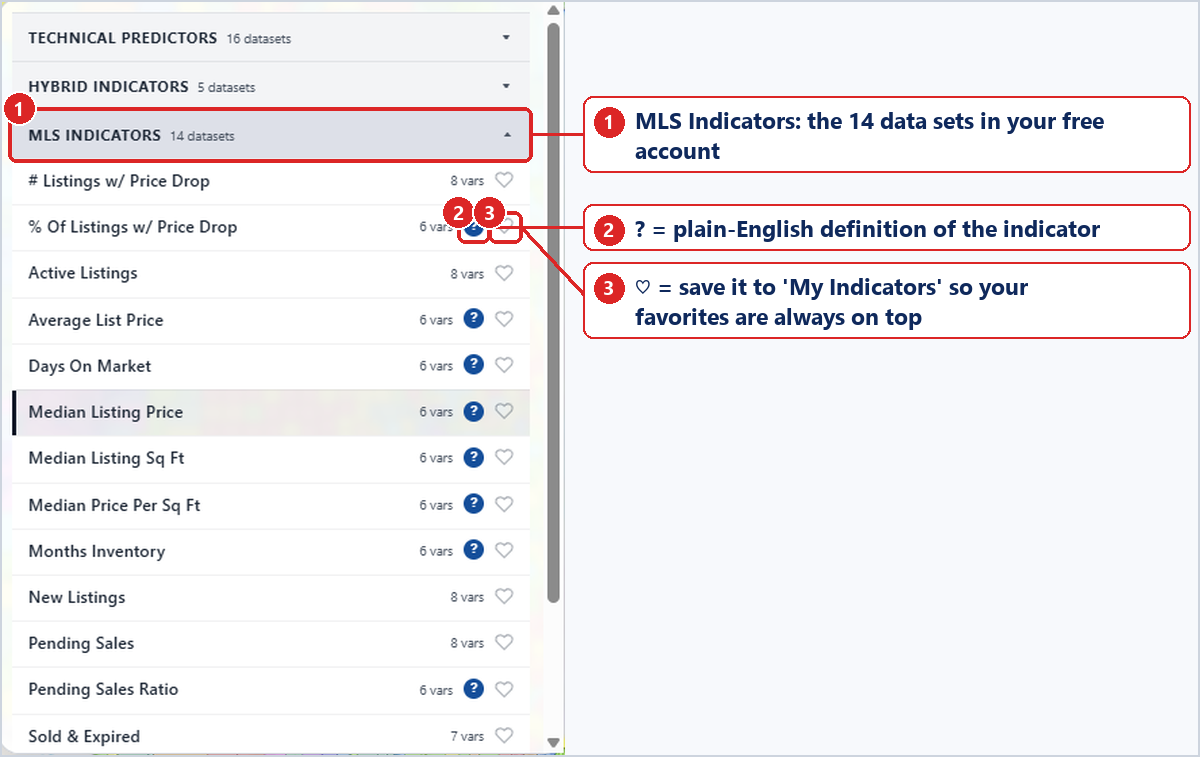
- ♡ next to an indicator saves it to My Indicators, so your favorites stay at the top of the menu.
- ? next to an indicator opens its definition.