Real Estate Strategy Blog
0

If you were surprised to learn that the two U.S. metro markets with the highest population growth for 2022, 2023 and 2024 were also some of the WORST markets for Home Price Appreciation, then this might blow your mind… Population Growth is NOT a Reliable Predictor of Home Price Appreciation Here are the eight fastest-growing […]
0

I know it may sound counter to everything you’ve been taught, but just because a market has a lot of population growth DOES NOT mean it’s good for home price appreciation. In fact, the opposite is often true. The U.S. population grows at less than 1% per year (usually around 7/10th of 1 %). So, […]
0
Published December 29, 2024

39.8% Of US Housing Markets Declined Qtr-Over-Qtr Last quarter, 161 markets (39.8% of all U.S. real estate) experienced ‘real’ (inflation adjusted) declines in property values compared to the prior Quarter. For the same period last year 148 markets (37%) saw Q-O-Q declines. Note: Because of seasonal variations between quarters, it’s best to compare Q-O-Q changes […]
0
Published September 17, 2024

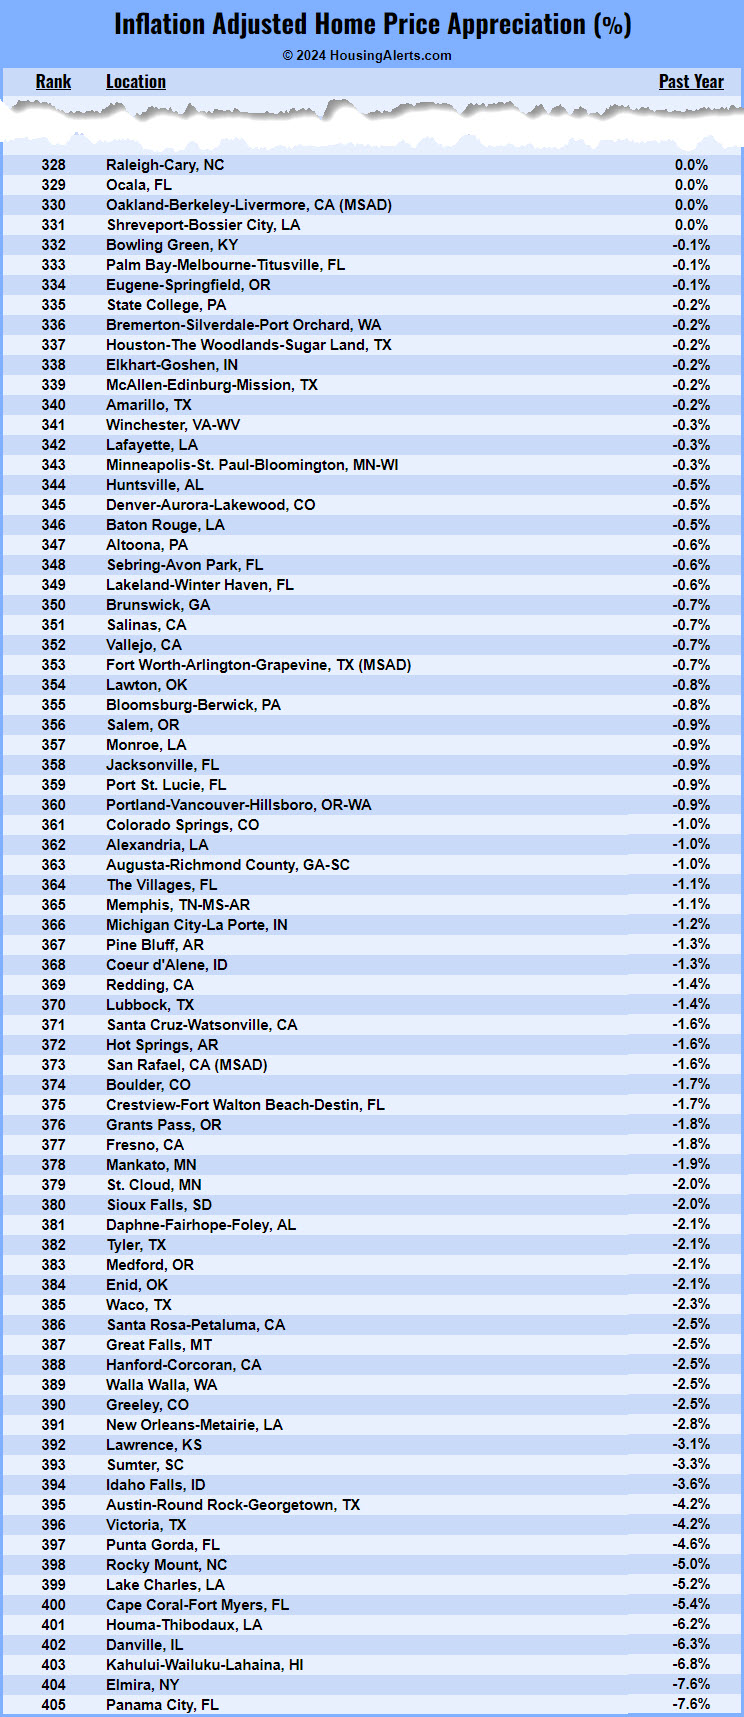
78 U.S. Markets Lost Value Year-Over-Year Last quarter, home prices declined Year-over-Year (YoY) on a ‘real’ (inflation-adjusted) basis in 78 (19.3%) of the 405 largest metropolitan real estate markets nationwide. In the previous quarter, 88 markets had annual home price declines. (See the entire list of declining markets below.)Last quarter, 14 metro markets (spread across […]
0
Published September 6, 2024

15.8% Of US Housing Markets Declined Qtr-Over-Qtr Last quarter, 64 markets (15.8% of all U.S. real estate) experienced ‘real’ (inflation adjusted) declines in property values compared to the prior Quarter. For the same period last year 215 markets (53%) saw Q-O-Q declines. Note: Because of seasonal variations between quarters, it’s best to compare Q-O-Q changes […]
0
Published June 14, 2024

53% Of US Housing Markets Declined Qtr-Over-Qtr Last quarter, 215 markets (53% of all U.S. real estate) experienced ‘real’ (inflation adjusted) declines in property values compared to the prior Quarter. For the same period last year 251 markets (62%) saw Q-O-Q declines. Note: Because of seasonal variations between quarters, it’s best to compare Q-O-Q changes […]
0
Published June 5, 2024

88 U.S. Markets Lost Value Year-Over-Year Last quarter, home prices declined Year-over-Year (YoY) on a ‘real’ (inflation-adjusted) basis in 88 (21.7%) of the 405 largest metropolitan real estate markets nationwide. In the previous quarter, 103 markets had annual home price declines. (See the entire list of declining markets below.) Sixteen markets saw double-digit appreciation; only […]
0

If you’ve done much marketing for real estate ‘Motivated Seller’ leads you’re probably familiar with “List Stacking.” I did my first List Stacking over 30 years ago by combining delinquent property tax lists with out of state and vacant landowners of 50 acres or more. I used the same stacking strategy going from county to […]
0

As part of our multi-year development project creating FIVE (5) new local market prediction algorithms, we also created the PRECISION MARKET TOOLS (“PMT”) as a streamlined way to access these new predictors and over 100 other indicators we’ve developed over the years. The HousingAlerts PRO dashboard has grown to include over 30 different tools, including […]
0
Published March 12, 2024

59.5% Of US Housing Markets Declined Qtr-Over-Qtr Last quarter, 241 markets (59.5% of all U.S. real estate) experienced ‘real’ (inflation adjusted) declines in property values compared to the prior Quarter. For the same period last year 289 markets (71.3%) saw Q-O-Q declines. Note: Because of seasonal variations between quarters, it’s best to compare Q-O-Q changes […]
0

The most accurate local real estate market prediction system on planet Earth just got 10x better (Proof Below). Don’t invest blindfolded… Save thousands of dollars in marketing each month while reducing your time, effort, capital, risk and frustration by targeting “tomorrow’s” hottest markets TODAY! No matter what the world threw at it, our algorithms predicted […]
0
Published March 4, 2024

103 U.S. Markets Lost Value Year-Over-Year Last quarter, home prices declined Year-over-Year (YoY) on a ‘real’ (inflation-adjusted) basis in 103 (25.4%) of the 405 largest metropolitan real estate markets nationwide. In the previous quarter, 129 markets had annual home price declines. (See the entire list of declining markets below.) A handful of markets are seeing […]


