Click Here To Grab Your FREE Account NOW!
It’s a state you wouldn’t normally think of, but clearly there’s something going on here that you should take a deeper look at.
Before I reveal the state (try not to scroll down 🙂 ) you need to understand exactly what we’re looking at in the image below.

We’re looking at a screenshot of our Hot Market Finder tool with the filter set to only show the seven major real estate markets in this one state. Note that it tracks six critical indicators over three 3 different time periods.
This Hot Market Finder tool is available with every PRO account. If you don’t have an account, you can grab one here.
The 3 periods we’re looking at are the current period, the quarter prior to the current period, and the same period this time last year.
The Master Score (outlined in red) uses advanced algorithms to identify and rank markets using a scale of 0-99.
99 being the hottest, and 0 being the crummiest.
You can see that every market in this state has improved over the year-ago period except for 1… they’re still getting stronger!
The next image below shows our Combined T.A.P.S score which factors in the technical analysis of the local, county, state, and national T.AP.S. scores.
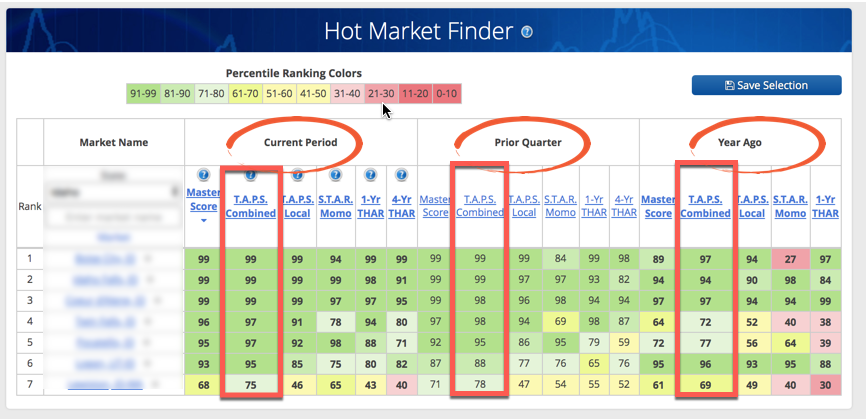
Technical analysis is a time-tested investing discipline usually applied to stock markets, but we’re the originators and inventors of using Technical Analysis for predicting real estate markets.
The next image below shows the Local T.A.P.S. score. Essentially it’s the Technical Analysis for that specific market.
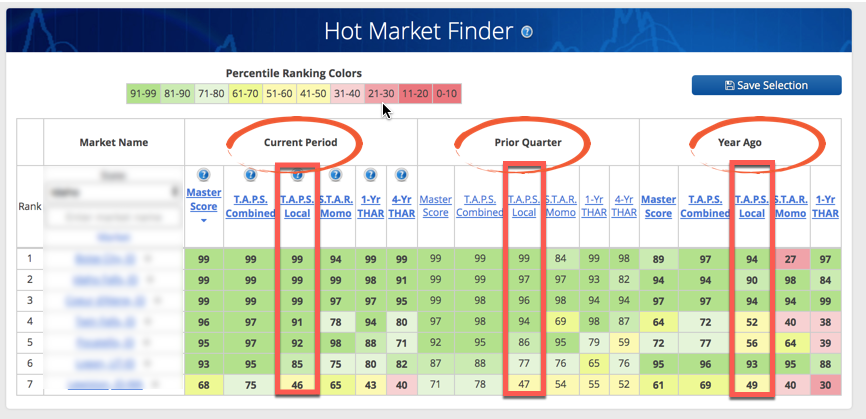
The next column we’re looking at in the image below is the S.T.A.R. momentum tool. This indicator tracks the ‘long range’ momentum of a market. On its own, it’s not an indicator of a HOT market, but when used in conjunction with the T.A.P.S. and Wealth Phase chart, it can reveal quite a bit about the long-term outlook of a market.

Lastly, in the image below we can see the 1-Yr and 4-Yr THAR (Total Home Appreciation Rate) which ranks each market relative to all US markets based on the previous 1-year and 4-year ‘raw’ total home appreciation.
Like the S.T.A.R. tool, this tool should only be used in conjunction with the other tools and indicators we provide, not as a stand alone decision trigger.
You can see this in the image below:

So… what’s the state?
It’s Idaho, and I hope you didn’t just scroll down to see the state and miss all the nuggets in the article above :-). You should go back and read it, if you did!
We’ve been seeing these Idaho markets showing up in many of our HOT market indicators for a couple years now. As with EVERY real estate market, the cycle eventually reverses. For now, Idaho just keeps getting stronger.
Of course our members who have a HousingAlerts PRO account get all this information included with their membership.
Did you know that you can grab a PRO account for about $16/mo when you choose an annual account for your specific market?
Check it out here to become a complete master of your market, today!
We have been rolling out some amazing new micro market tools for Wholesalers and Rehabbers. Our Neighborhood Ranking tool alone should save you thousands a month in targeted acquisition and lead generation costs. Click here to buy now.


