Click Here To Grab Your FREE Account NOW!
10 Best & Worst States for CASH FLOW
With our new Cash Flow Finder tool, you can now identify the best and worst real estate markets for cash flow investing.
Using the ‘Gross Rent Ratio’ (Median Annual Rent /Median Home Value) as a proxy for cash flow, you can see the 10 best and worst states below.

Note that the 10 best cash flow states have a Gross Rent Ratio ranging from 9.2% up to 10.8%.
Given the exceptionally low interest rate environment, those are very attractive gross yields for a state-wide average. (When you drill down into cities, counties and zip codes, you’ll find a much greater range in rent yields.)
Does this mean you should target these top five ‘cash flow’ states for investing?
Absolutely NOT!
Investing ONLY for Cash Flow can be Foolish.
The Vast Majority of Real Estate’s Total ROI comes from Leveraged Appreciation, NOT Cash Flow.
Because Cash Flow is typically an insignificant part of the TOTAL ROI from real estate, you need to look for those rare opportunities for cash flow AND appreciation.
Many seasoned investors know the main ‘benefit’ of cash flow or rent is simply to contribute towards or (ideally) cover your operating and mortgage expenses so that you can stay in the game longer and reap all the leveraged appreciation.
Unfortunately…
Most high cash flow markets are
the weakest markets for appreciation.
But…
There ARE rare exceptions!
Let’s look at the same list from the Cash Flow Finder, but this time, note the Hot Market Score on the left. The five best states for cash flow all have very low Hot Market Scores.
Low Hot Market Scores (red colors) mean there isn’t much likelihood of appreciation and/or that there’s a good chance of DEpreciation, relative to all the other states.
The BEST you can hope for in these markets is a few extra bucks a month in operating cash flow as your TOTAL return.
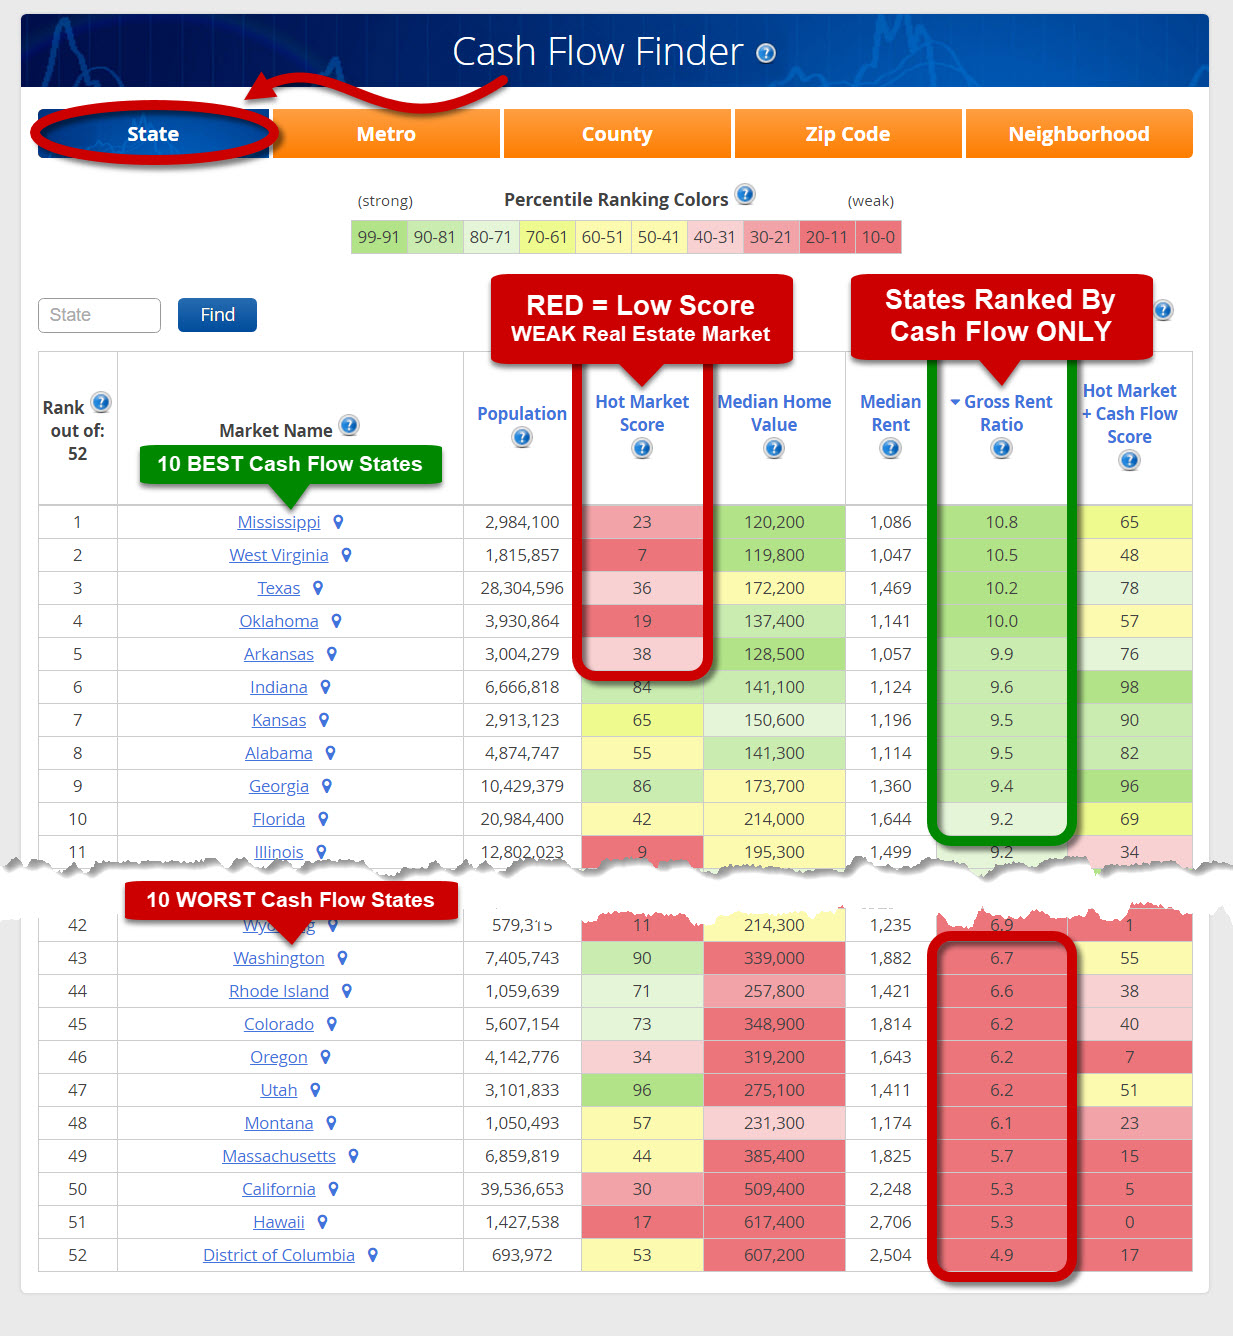
See how the top five states for cash flow (MS, WV, TX, OK & AR) also have weak Hot Market Scores (highlighted in red)?
Investing in those highest cash flow markets provide little likelihood for significant appreciation and a relatively higher risk for LOSING significant money due to DEPRECIATION.
It’s not an attractive RISK-ADJUSTED return, especially when there are MUCH BETTER alternatives.
In a WEAK local market, property appreciation is less likely, declines are more likely.
Even a small decline in property value can offset YEARS of monthly cash flow gains. Continued declines wipe-out equity, leaving investors upside down and out of exit options.
Instead of the single-focus investment strategy of targeting “high cash flow” markets, your TOTAL ROI will likely be much higher when you also target strong markets.
With the Cash Flow Finder tool, that’s now possible in a single click.
See (above) how the NEXT 5 states (IN, KS, AL, GA & FL) have either a ‘fair’ (Yellow color) or a ‘strong’ (green color) Hot Market Score?
They ALSO have high Gross Rent Ratios!
INDIANA and GEORGIA (in particular) both currently have very high Gross Rent Ratios (Cash Flow) **AND** have very strong Hot Market Scores.
It gets even better…
We can re-rank the Cash Flow Finder tool to factor-in **BOTH** Cash Flow AND Appreciation.
Here’s the same tool but ranked according to the COMBINED scores.
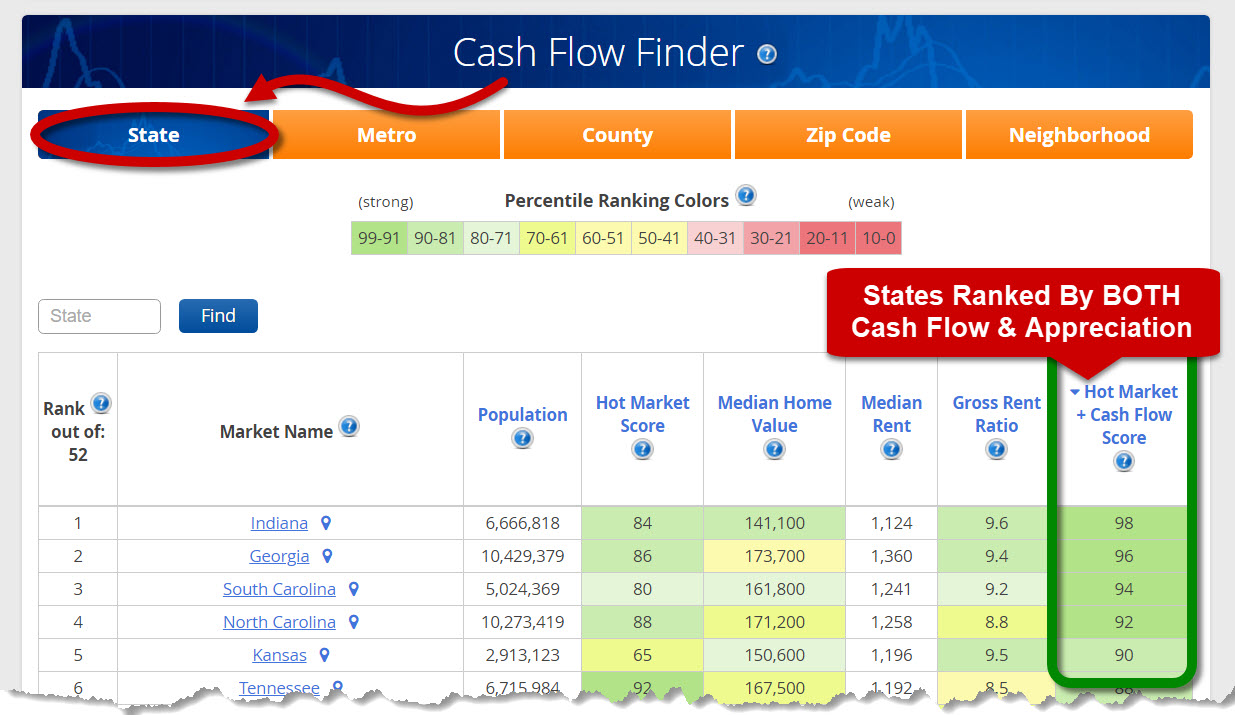
You can see in the list above, the states of IN, GA, SC, NC & KS can provide a MUCH HIGHER RISK-ADJUSTED TOTAL RETURN while still ranking as top states for Cash Flow!
Welcome to the world of Intelligent investing!
Here’s what the current US Map looks like optimized for Cash Flow PLUS Appreciation at the STATE level…
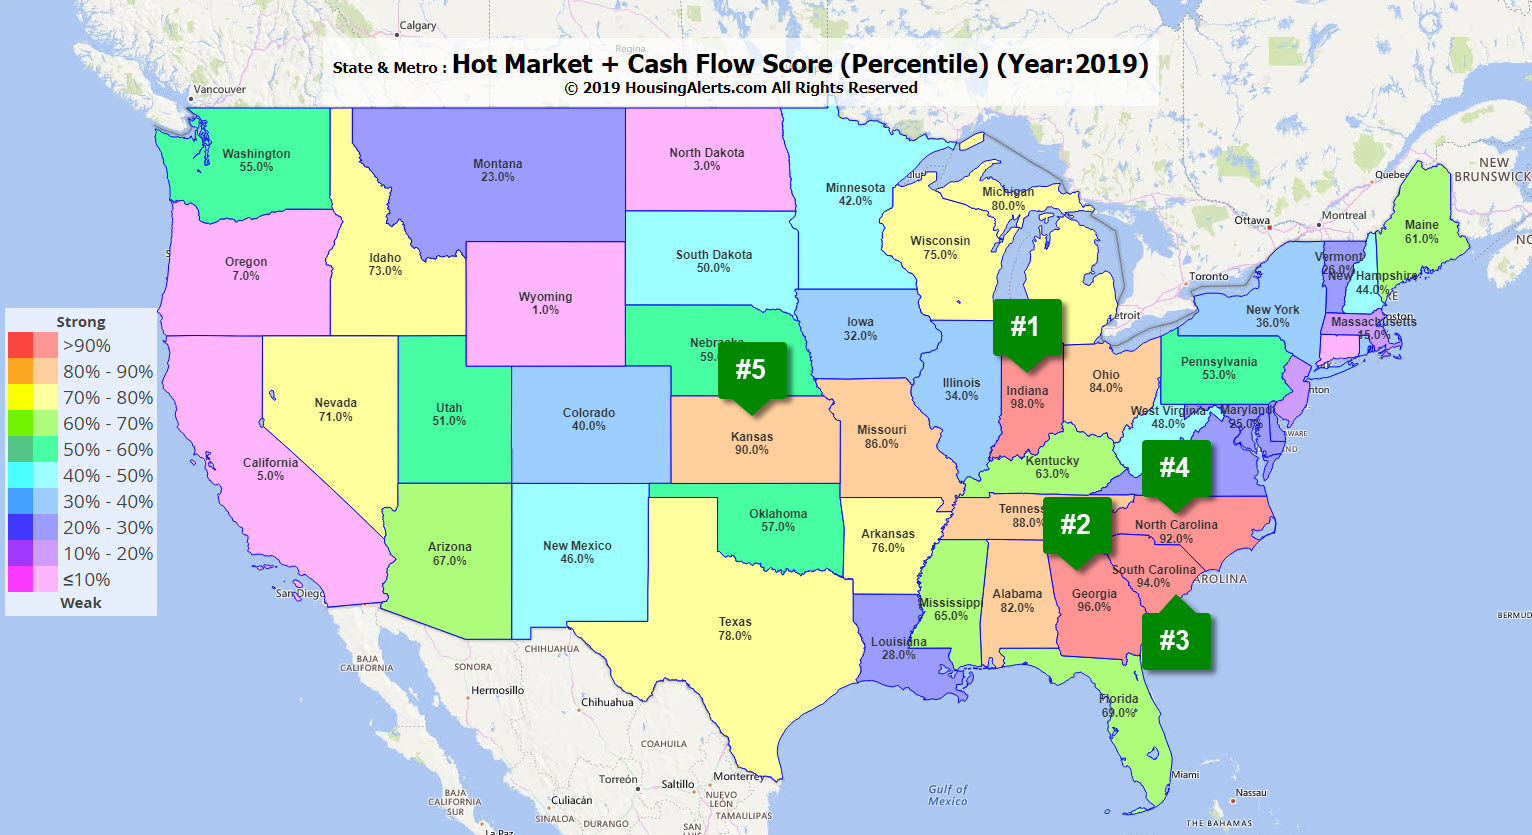
Seeing ALL US states in one view, color coded by their Cash Flow and Hot Market combined scores helps spot bigger trends, like what is happening in the Southeast with GA, SC, NC, TN and AL.
It’s not a coincidence that the best states for cash flow + appreciation investing are contiguous!
It’s even more eye-opening when you run these same “Cash Flow + Hot Market Score” searches across the 400 Metro, 3,000 County, 18,000 zip code and 53,000 neighborhood markets we now cover!
The new Heat Maps, Micro Market Ranking, Home Value Finder and Cash Flow Finder tools used to create this article are (currently) included at no additional cost with every PRO account.
YOUR real estate success is a function of knowing where to employ your time, talent and capital for the highest returns with the lowest risk and effort, in the shortest time period.
Did you know that you can grab a PRO account for about $16/mo when you choose an annual account for your local market?
With HousingAlerts, you’ll never invest blindfolded again! Check it out here to become a complete master of your market, today!
Important Caveat: North Carolina, South Carolina and Georgia scored very high on the “Hot Market + Cash Flow” map above. Those states have plenty of hot, emerging, low-priced, cash flowing micro markets right now. They also have plenty of weak, crummy micro markets that you do NOT want to invest in.
Every sub-market is unique and has its own real estate cycle. You can’t just throw a dart at a map of those states and start investing ANYWHERE.
For maximum results, use HousingAlerts to drill down deeper; find the absolute best cities, counties, zip codes and even neighborhoods tailored for YOUR investing tactics and strategies.
We have been rolling out some amazing new micro market tools for Wholesalers and Rehabbers. Our Neighborhood Ranking tool alone should save you thousands a month in targeted acquisition and lead generation costs. Click here to buy now.


