0


Published July 17, 2018
Check out this new county-level real estate map for the entire U.S.
We’re now able to score micro markets (Counties, Zip Codes and Neighborhoods) and RANK them against all the other counties, zip codes and neighborhoods nationwide.
RED = the top 10% of all counties nationwide.
ORANGE = the 80 – 90 percentile
…
…
PINK & PURPLE = the bottom 10 and 20 percentile, respectively.
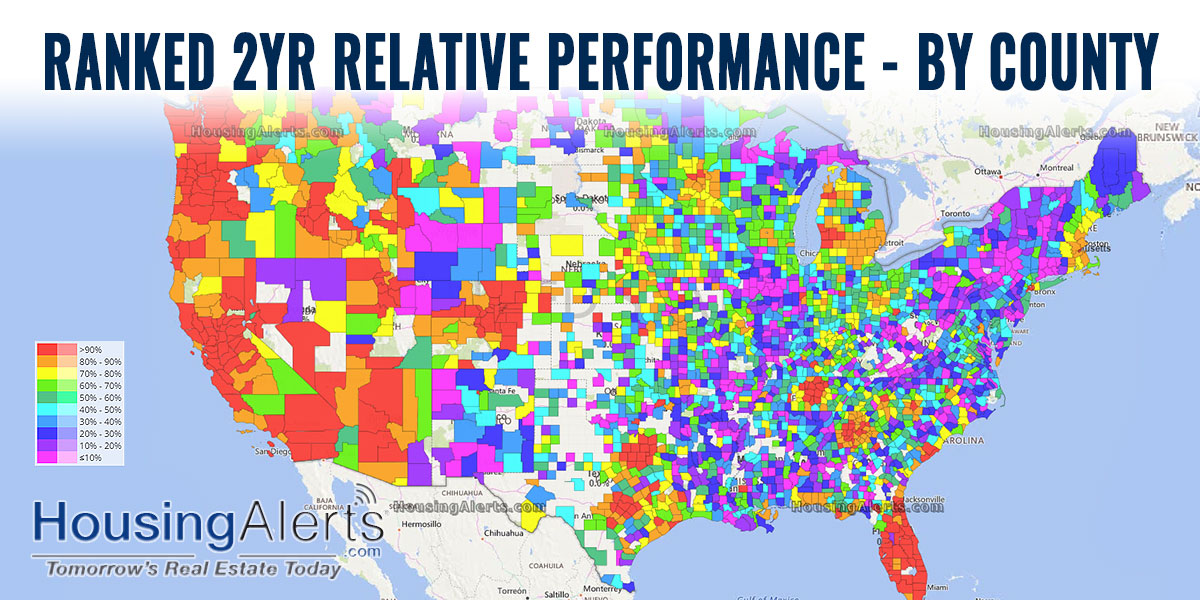
Ranking all the markets by ‘percentile’ and putting them all on a map gives you a completely different perspective. The strongest (and weakest) real estate markets almost jump off the page at you.
To get started with a single-city PRO account works out to about $16/mo when you choose the Annual plan.


