One of the many new powerful tools we offer is the “Cash Flow Finder“. In general, higher cash flowing properties are typically located in weak or flat markets. The higher cash flow reflects the increased market risk from lower anticipated property appreciation.
Locating the Cash Flow Finder tool
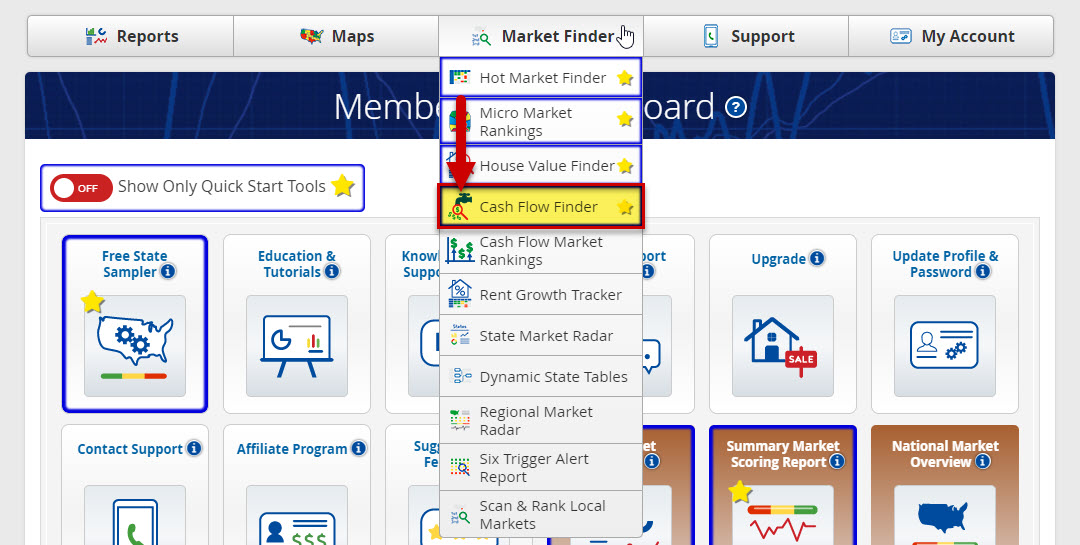
To find the Cash Flow Finder, simply click on the Market Finder tab on the menu bar, and select Cash Flow Finder from the drop-down list.
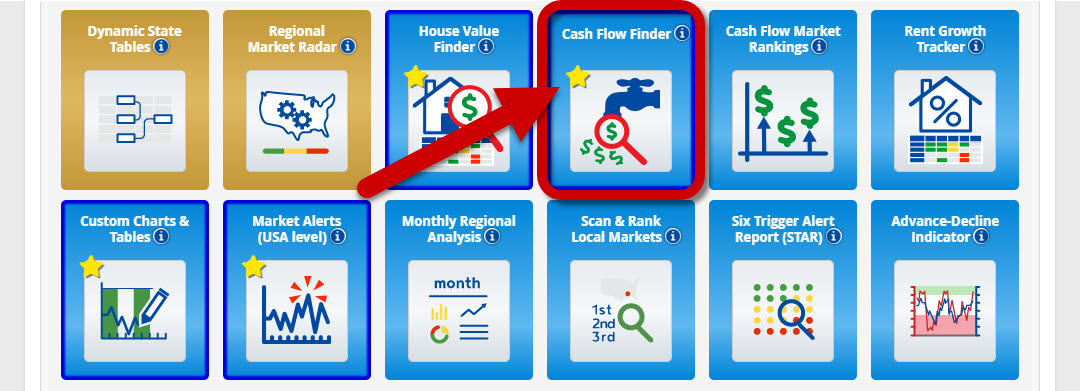
Or, you can locate it in the Dashboard (PRO section).
Using the Cash Flow Finder tool
Now, since every property is unique and every market is dynamic (changing), opportunities exist to find higher cash flowing properties in emerging or hot local markets. This tool overlays each market’s median home price, gross rent yield AND local ‘hot market score’ to help locate those markets more likely to produce higher TOTAL returns.
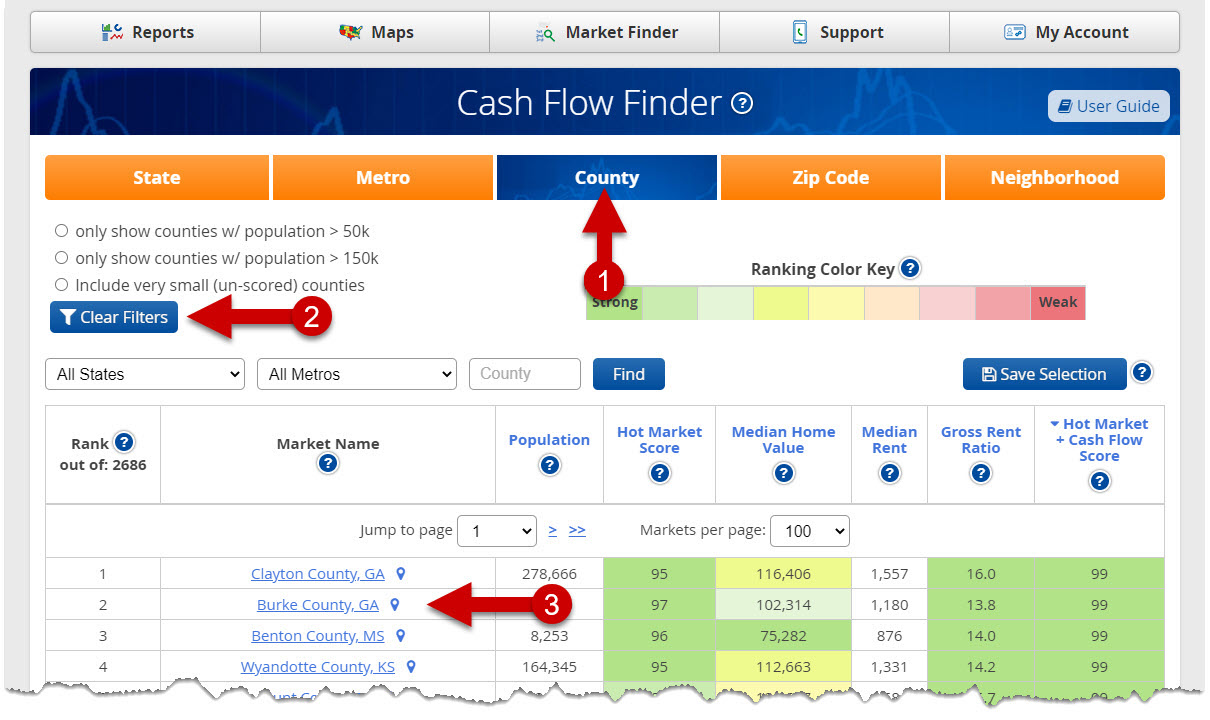
- You can search markets from the State to the Neighborhood level (orange buttons).
- Filter your search by population size.
- Click any market to view on map.
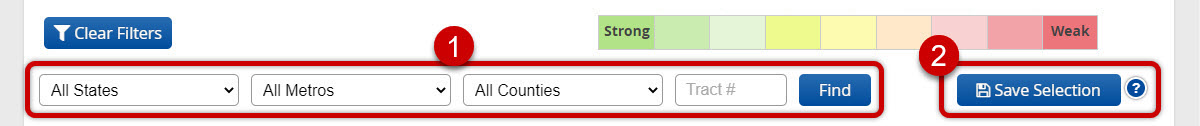
You can also drill down within each 1Market Type you’re subscribed to, as well as 2SAVE your selections to your My Market Tracker.
The Cash Flow Finder results default to the Hot Market Score + Cash Flow Score.
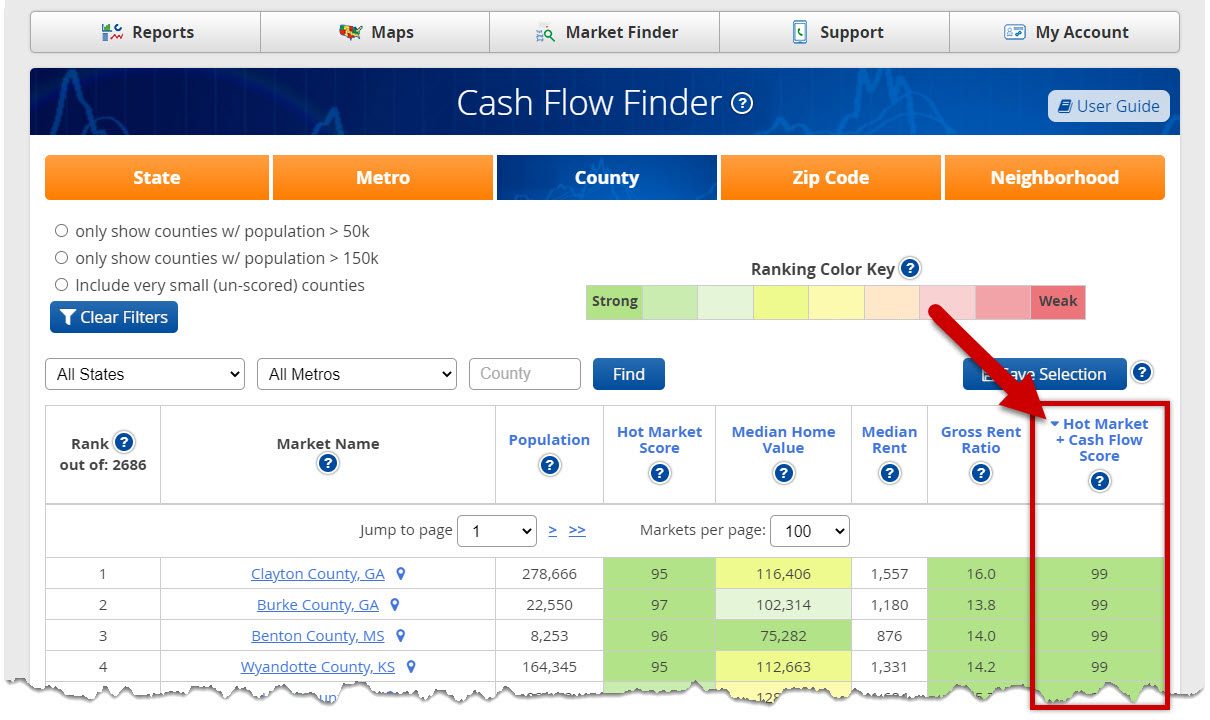
*Clicking the blue arrow in any column will reverse the order.
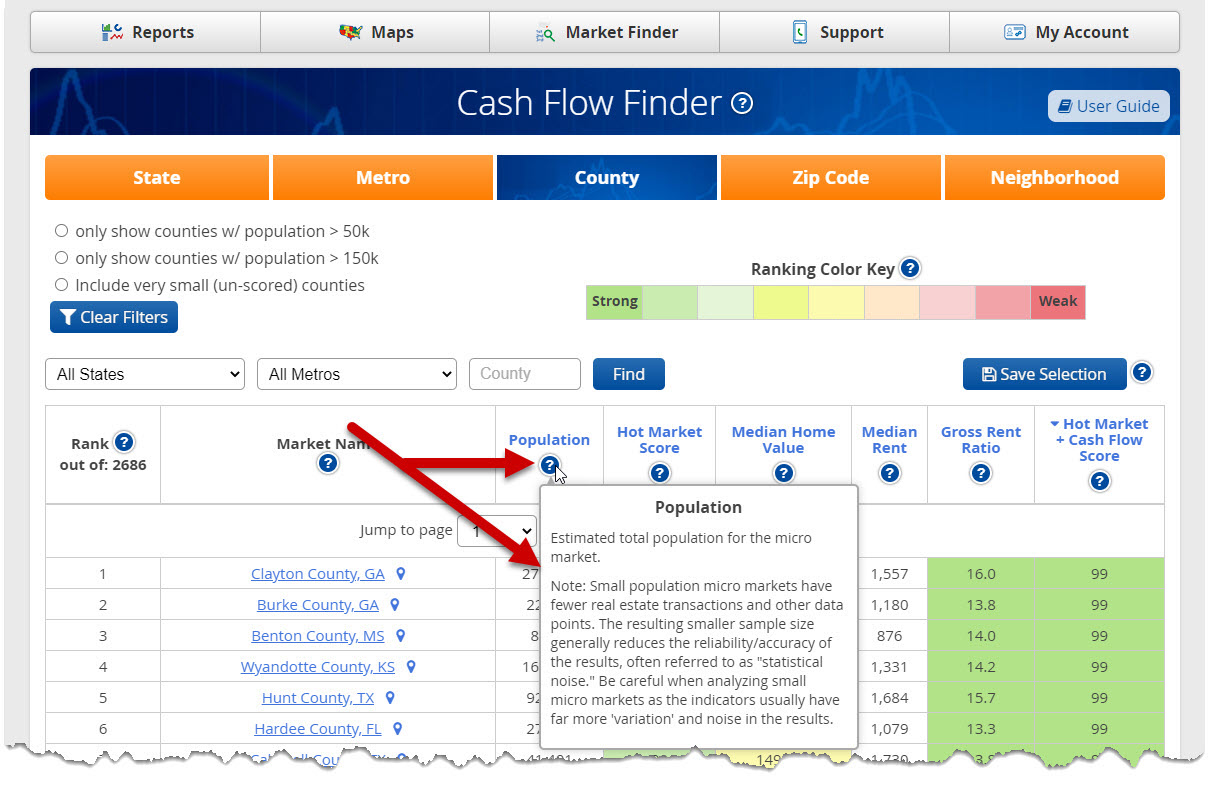
Hovering your cursor over any of the blue rollovers will give a description of each column.
(The Hot Market Score is a scoring system that assesses the health of any local real estate market, especially in terms of its likelihood for high appreciation.)
The markets shown were the highest scoring counties when this screenshot was taken. The blue-bordered column on the left is each county’s specific percentile ranking when compared to all other counties. (A score of ’99’ means THAT county scored higher than 99% of all counties nationwide.)
The green background color also relates to its percentile score (see legend near the top). GREEN means ‘good’ – in this column, that means a high Hot Market Score.
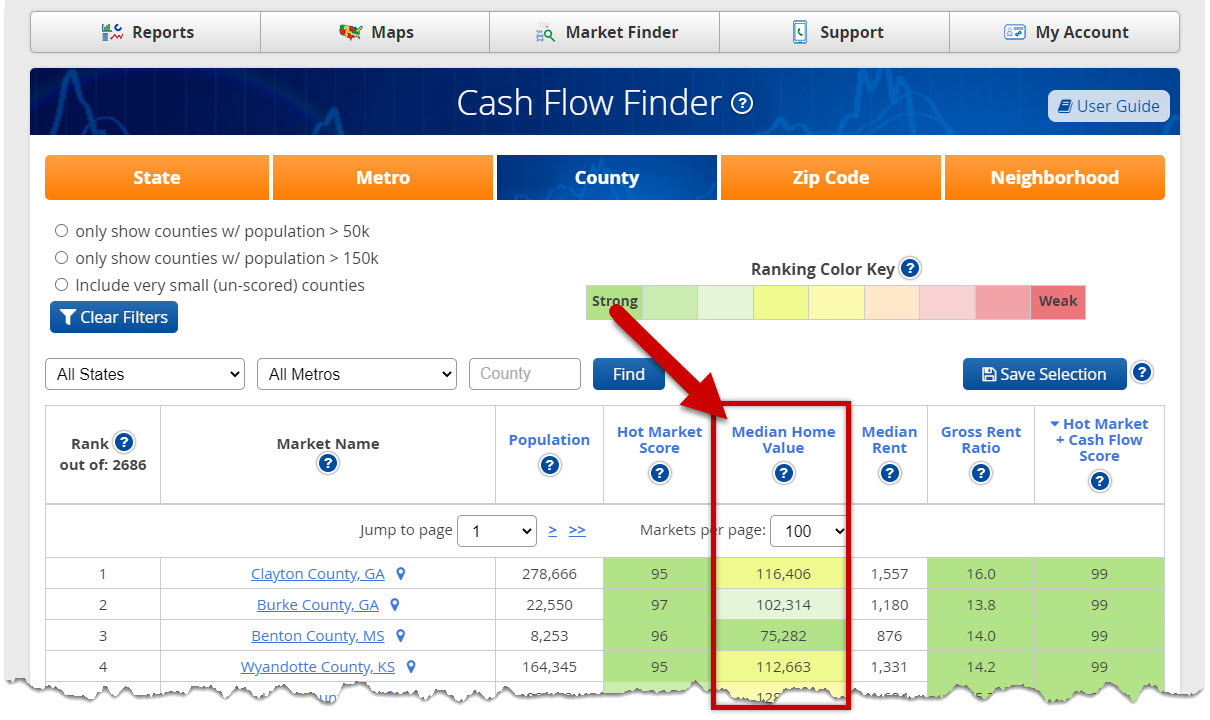
Next column we have Median Home Value, this is the estimated median house value of all Single Family Residential (SFR) properties in the micro market.
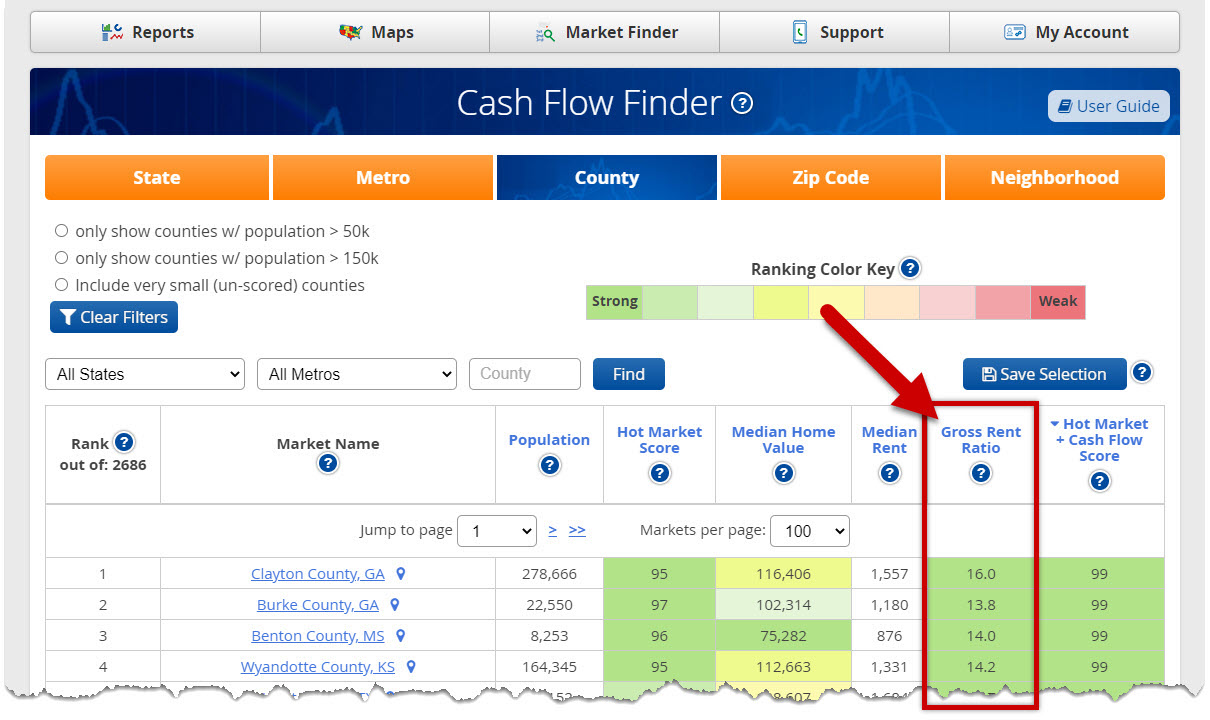
*Gross Rent Ratio – ‘Median Monthly Rent’ x (’12 months’ / ‘Median Home Value’).
Gross Rent Ratio is a good proxy for likelihood of cash flow. Of course, each property and each market will have different expense levels, but in general, a good ‘quick test’ for evaluating a property’s cash flow ability.
Some investors use the ‘1% Rule’ which states: If the monthly gross rent is equal to or greater than 1% of the purchase price, you’ve got a decent chance for positive cash flow (again, depending on the expense levels for the specific property).
A GRR of 12% is the same as the 1% Rule, the difference being the GRR is calculated on the ANNUAL (not monthly) gross rent.
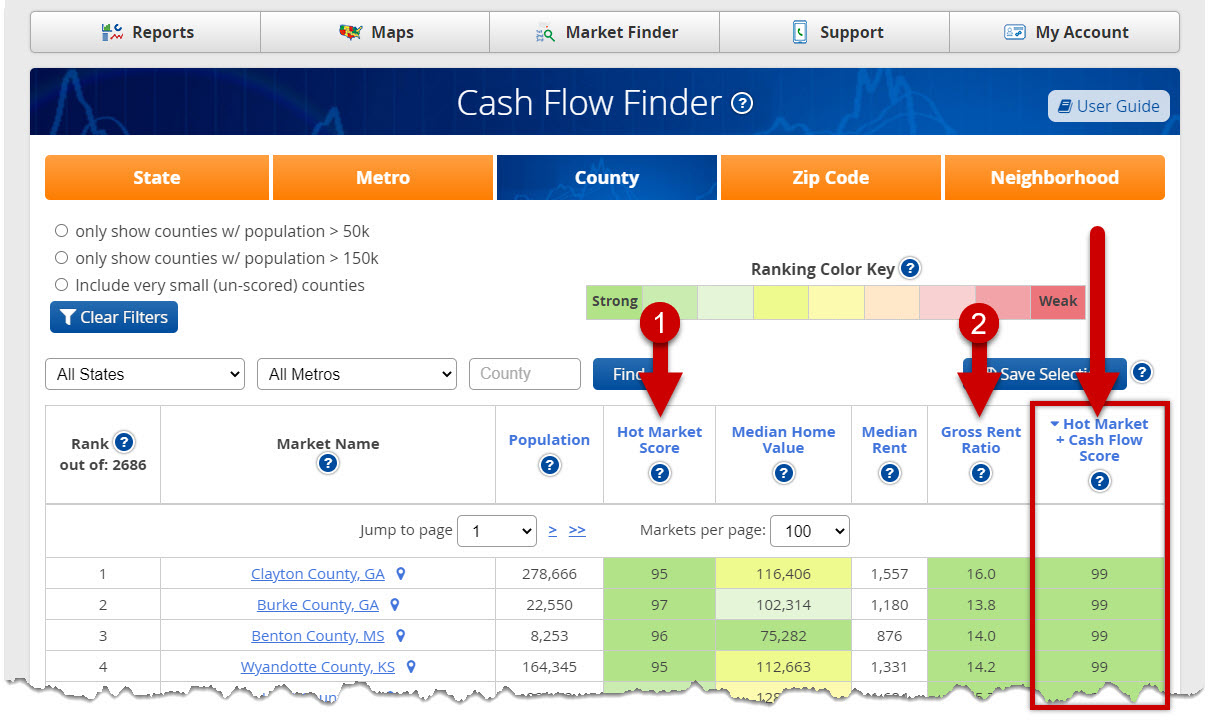
*Counties Ranked by Strongest 1Hot Market Score + 2Gross Rent Ratio.
We’ve re-ranked markets based on BOTH their Hot Market Score * AND * their Gross Rent Ratio, COMBINED.
In a single click of the column title, you now have an ordered list (from best to worst) of the highest cash-flowing counties in the U.S. You can do the same for every Zip Code and every neighborhood!
By using our proprietary algorithms, you’re now able to filter through all the micro markets nationwide – every County, Zip Code or Neighborhood in the country – in a single click.

