Question:
We are a smaller/mid-sized lender and we are trying to determine areas of potential loan risk given where we believe we are in the housing cycle. What reports might be most relevant? I also suspect that the answer might be different depending on the loan product, as we do both a shorter-term loan as well as provide longer-term 30-year loans.
Answer:
One of the more intelligent ways to utilize these tools is in computing the ‘risk-adjusted’ return for different markets.
For example, an identical property in Athens GA vs Valdosta, GA (as of the date I write this)… (or any Hot vs Crashing market) should have very different CAP rates, given the very different risks and the likelihood of appreciation/depreciation.
Markets with a low probability of significant appreciation sell for higher CAP rates because they are riskier. Long-term flat or declining markets will cash flow much higher than its counterpart in a hot, vibrant market because there is a lower total ROI and greater risk for loss of principal/equity.
The same concept should apply to lenders for exactly the same reason. Flat and declining markets should command higher interest rates because they are higher risk loans.
We look at TWO broad categories (variables) to analyze a market:
- Technical Score (TAPS slider balls)
- Momentum (red, yellow, green STAR traffic signal icons)
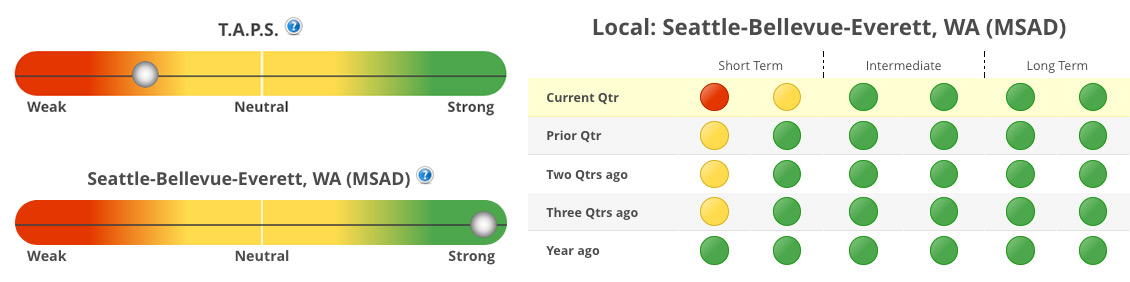
These are both important and INDEPENDENT variables. They do not always agree/align.
So with that as background, the easiest way to begin assessing that risk is to use the Hot Market Finder (‘HMF’) tool. There are several indicators on the HMF you can use to rank markets.
When ENTERING a new market (or pricing a new loan), we want to see BOTH a strong STAR momentum indicator (lots of green, especially in the Intermediate and Long Term columns) and strong TAPS scores. A strong STAR score (along with a high TAPS score) makes it less likely the market will roll over and go negative any time soon.
The first step is confirming if your market is even in a Wealth Phase. Assuming it is, here’s a rough ranking of each of the HMF tool/indicator’s relative importance when ENTERING a new market or initiating a new acquisition (loan):
- Wealth Phase
- Master Score
- STAR Momentum
- TAPS Combined
- TAPS Local
- 1 YR THAR
- 4 Yr THAR
Clicking on those Column Titles in the HMF shows where your market ranks in relation to all markets.
For your 30-year product, is the average duration still closer to 7-10 years?
If yes, then these tools can be very useful in pricing or assessing risk. Even though your options are limited once the loan closes, you should still know where your portfolio’s risks are.
I’d treat it similar to owning the real estate and evaluating a hold/sell decision.
Once you are ALREADY invested in a market, because of the transaction cost and effort to EXIT a market, we are less concerned with the STAR indicator EXCEPT as an early warning indicator… it can give a year or more advance warning of a market reversal. (see this video for more, starting about 10 minutes in)
If the market is no longer in a (green) Wealth Phase, it’s a matter of figuring out ‘how bad is it?’
The HMF is useful here as well, but with a slightly different weighting of the six indicators.
Here’s a rough ranking of each tool/indicator’s relative importance when contemplating the best time to EXIT a market:
- Wealth Phase
- TAPS Local
- 1 YR THAR
- Master Score
- TAPS Combined
- STAR Momentum
- 4 Yr THAR
Note that for EXITING a market, the STAR tool (momentum) is less important as a decision trigger compared to ENTERING a new market.
If you’re not ‘stuck’ in a single market WHEN you leave a market is more a question of “OPPORTUNITY COST” rather than milking any single market for the last bits of appreciation.
In general, as a market accumulates more red STAR icons (losing momentum) AND the TAPS indicators are consistently getting weaker, it means the risks of decline are increasing; the likelihood of big appreciation is lessening. The risk/reward tradeoff isn’t as strong.
As a “Total Market Master” looking to ride appreciation waves from one market to the next, I focus more on the Hot Market Finder tool to track where my markets are RELATIVE to other markets nationwide (if you have access to those other markets). That way, I can jump into new, emerging markets that may offer significantly higher appreciation at a lower risk.
Lastly, for a true 30-year loan for which you do not expect an early payoff, I have two suggestions:
- Focus on the hottest markets. If you can get an extra equity cushion in the first few years from fast appreciation, you reap the benefit of lower LTV and are better positioned should something change down the road.
- I presume these are not equity participation loans, right? If yes, consider avoiding the highly cyclical markets. Many Texas markets are good examples; for most of the last 25 years, they did not gain much or lose much compared to the highly cyclical markets. As a lender with no participation in the upside, your goal is to avoid massive downsides, where your collateral evaporates and borrowers walk away.
There are a number of ways to find these flat/stable markets. You could simply look at each State’s 40-year chart. Once you find some good ‘flat’ states, drill down into their local markets (look at their charts, at the bottom of the Summary Market Scoring Report).
Or you could do a quick ‘Scan’ using the classic “Scan & Rank” tool (see screenshot). Set a custom time period of 2008 to 2012 and look at those markets which declined the least.
Confirm their history as a flat, stable market by looking at their long term charts.

Last update of the article: 05/08/2020.

