You can’t track small sub (zip code) markets as a stand-alone entity and expect useable, back-testable, provable results. It’s gibberish.
1) Use Technical Analysis with reliable sample sizes.
2) Use TA with proper time frame (see below).
3) Sub-market results are the END point of a complex market analysis, not a starting point. You must work DOWN from USA, Regional, State, Metro, County, City, Zip, Tracts, Block Groups.
We’ve automated the entire process. Anyone can do this if they can read a Traffic Signal.
We get lots of questions about the proper market ‘Time Frame’ – here’s a stock market example that might help.

In this 4-Hour chart, the stock is trending up strongly – 50% gain in less than 2 weeks. Would you invest in this one? It’s in a strong uptrend, right?
Trick question…
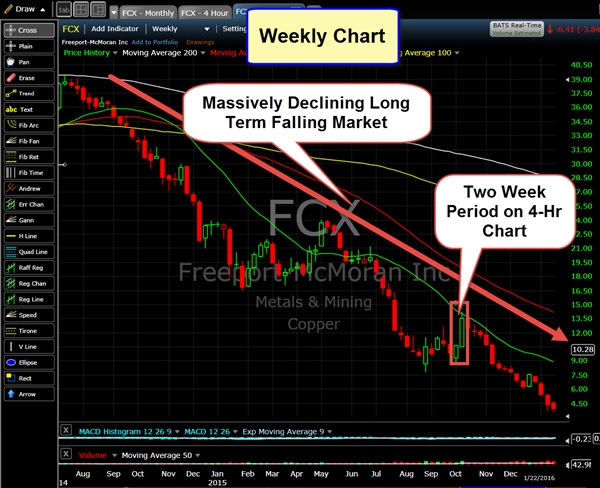
As you can see from this WEEKLY chart, it’s in the middle of a multi-year crash. The 4-Hour chart above (showing the big uptrend) was the WRONG time frame – it gave you false results. It lost another half of its value shortly thereafter.
The same thing happens in real estate, only much slower. Much more cyclical and much more predictable if you’re using the right time frames. Even if you could get valid results from weekly data (you can’t) – who would want it?
It’s a classic case of “You can’t see the forest for the trees.”
A lot of real estate investors jumped back in to markets like Las Vegas, etc way too early. Don’t know if they were relying on short time frame data, or just going by gut, but we all saw what happened to them.
Grab your FREE State Account right now! Click here to start

