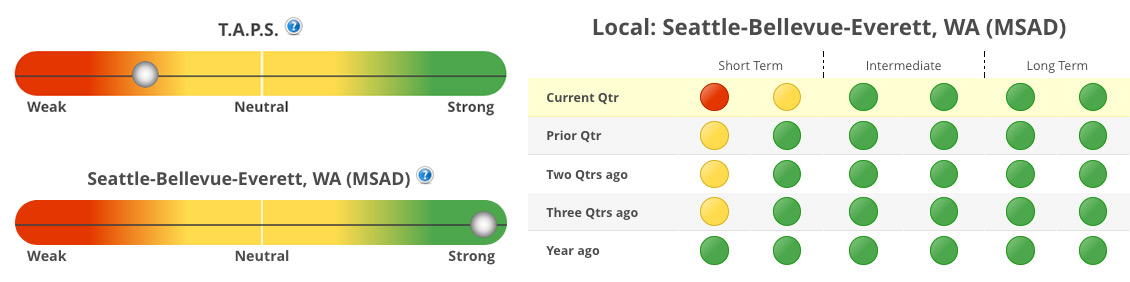
The Green, Red, & Yellow icons in the S.T.A.R. (Six Trigger Alert Report) tool represent the status of the six Technical Analysis (TA) decision triggers, for each quarter.
Green color icon means the market is trending ABOVE that trigger for that time period.
Red color icon means the market is trending BELOW that trigger for that time period.
Yellow color icon means the market activated that trigger in the current period.
This market filter is very accurate for identifying strong trends (up or down). However, since it is a ‘pure’ trend finder, it does not always take into consideration the current state of appreciation or depreciation (locally and regionally)… it only looks at trends.
Thus, the filtered results you see below are also combined and ranked using our proprietary TA scoring system (the slider bar with ‘strength’ indicator.) Generally, the markets in the upper half of the search results are appreciating the fastest.
Regarding the charts, if you are in the STAR tool and search for the markets, you will get this result: