The different colors show the energy behind any market. Green means positive, upward sloping momentum. Red means the opposite. Yellow occurs when, in the current period, the slope/direction changes for the specific trigger.
The first step in locating investment candidates is evaluating the S.T.A.R. indicators. Each of the six ‘triggers’ represent a distinct Technical Analysis (TA) ‘event.’
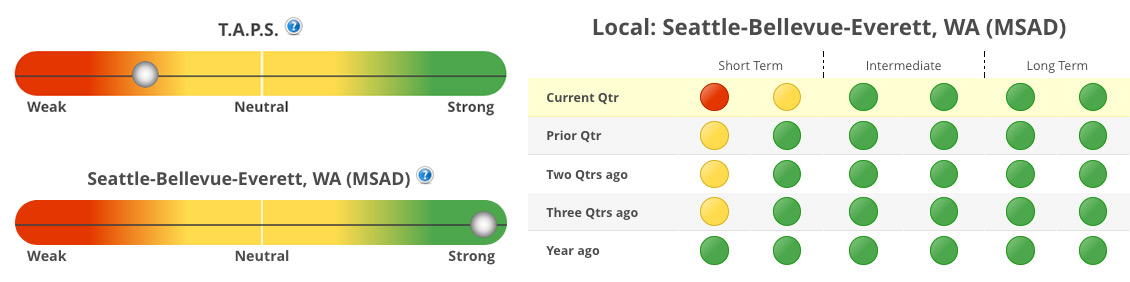
The left-most columns are Short-Term triggers and carry far less significance than the Long-Term indicators on the right.
The *long term STAR triggers (at a minimum) should all be green in the current period to initiate a new investment in that market if the TAPS indicator is showing “strong” (or close to it) and if the market is already in a green “Wealth Building” phase on the Market Scoring Report.
However, all Trend Reversals (up or down) BEGIN with the short term triggers. They provide early-warning signals, especially when they develop a consistent pattern of changing colors (from green to red, or red to green) ‘growing’ from left to right.
Markets that do not display a consistent one-color pattern; with seemingly random (horizontal) color changes from one period to the next, especially in the long-term triggers, are generally lacking ANY momentum, and are poor investment markets for Leveraged Appreciation.
There are additional tools and methods to confirm these signals, such as looking at nearby markets and/or seeing where your market ranks on the ‘Master’ score/filter.
This video explains the STAR and TAPS in more depth: TAPS & STAR Tutorial video

