We got a great question from an investor who had just watched our “Total Market Master” training video.
He looked closely at the buy and sell arrows on the charts and said:
“It looks like the buys are late in the upswing and the sells are late in the down cycle. I thought HousingAlerts would get me in early and out near the top, with time to spare.”
It’s a fair question. The answer comes down to two things:
- What the Wealth Phase chart actually measures.
- The early-warning tools on the Smart Market Report that most people skip: Focus Mode and the Advanced Mode indicators.
We’ll use a real market to show all of it. It’s our hometown market: Ocala, FL.
Part 1: The Wealth Phase chart doesn’t plot prices
This is the #1 misunderstanding.
The blue line is not the price of a house. It’s the rate of change: how fast prices are rising or falling over the past year.
That changes how you read everything on the chart:
- Above the zero line, prices are still going up. They might be rising more slowly than last quarter, but they’re rising.
- Below the zero line, prices are falling.
- So prices top out when the line crosses zero, not when the line peaks.
So when a buy arrow and a sell arrow sit at the same height, the price didn’t stay flat. Prices were rising at about the same speed on both dates, and they went up the whole time in between.
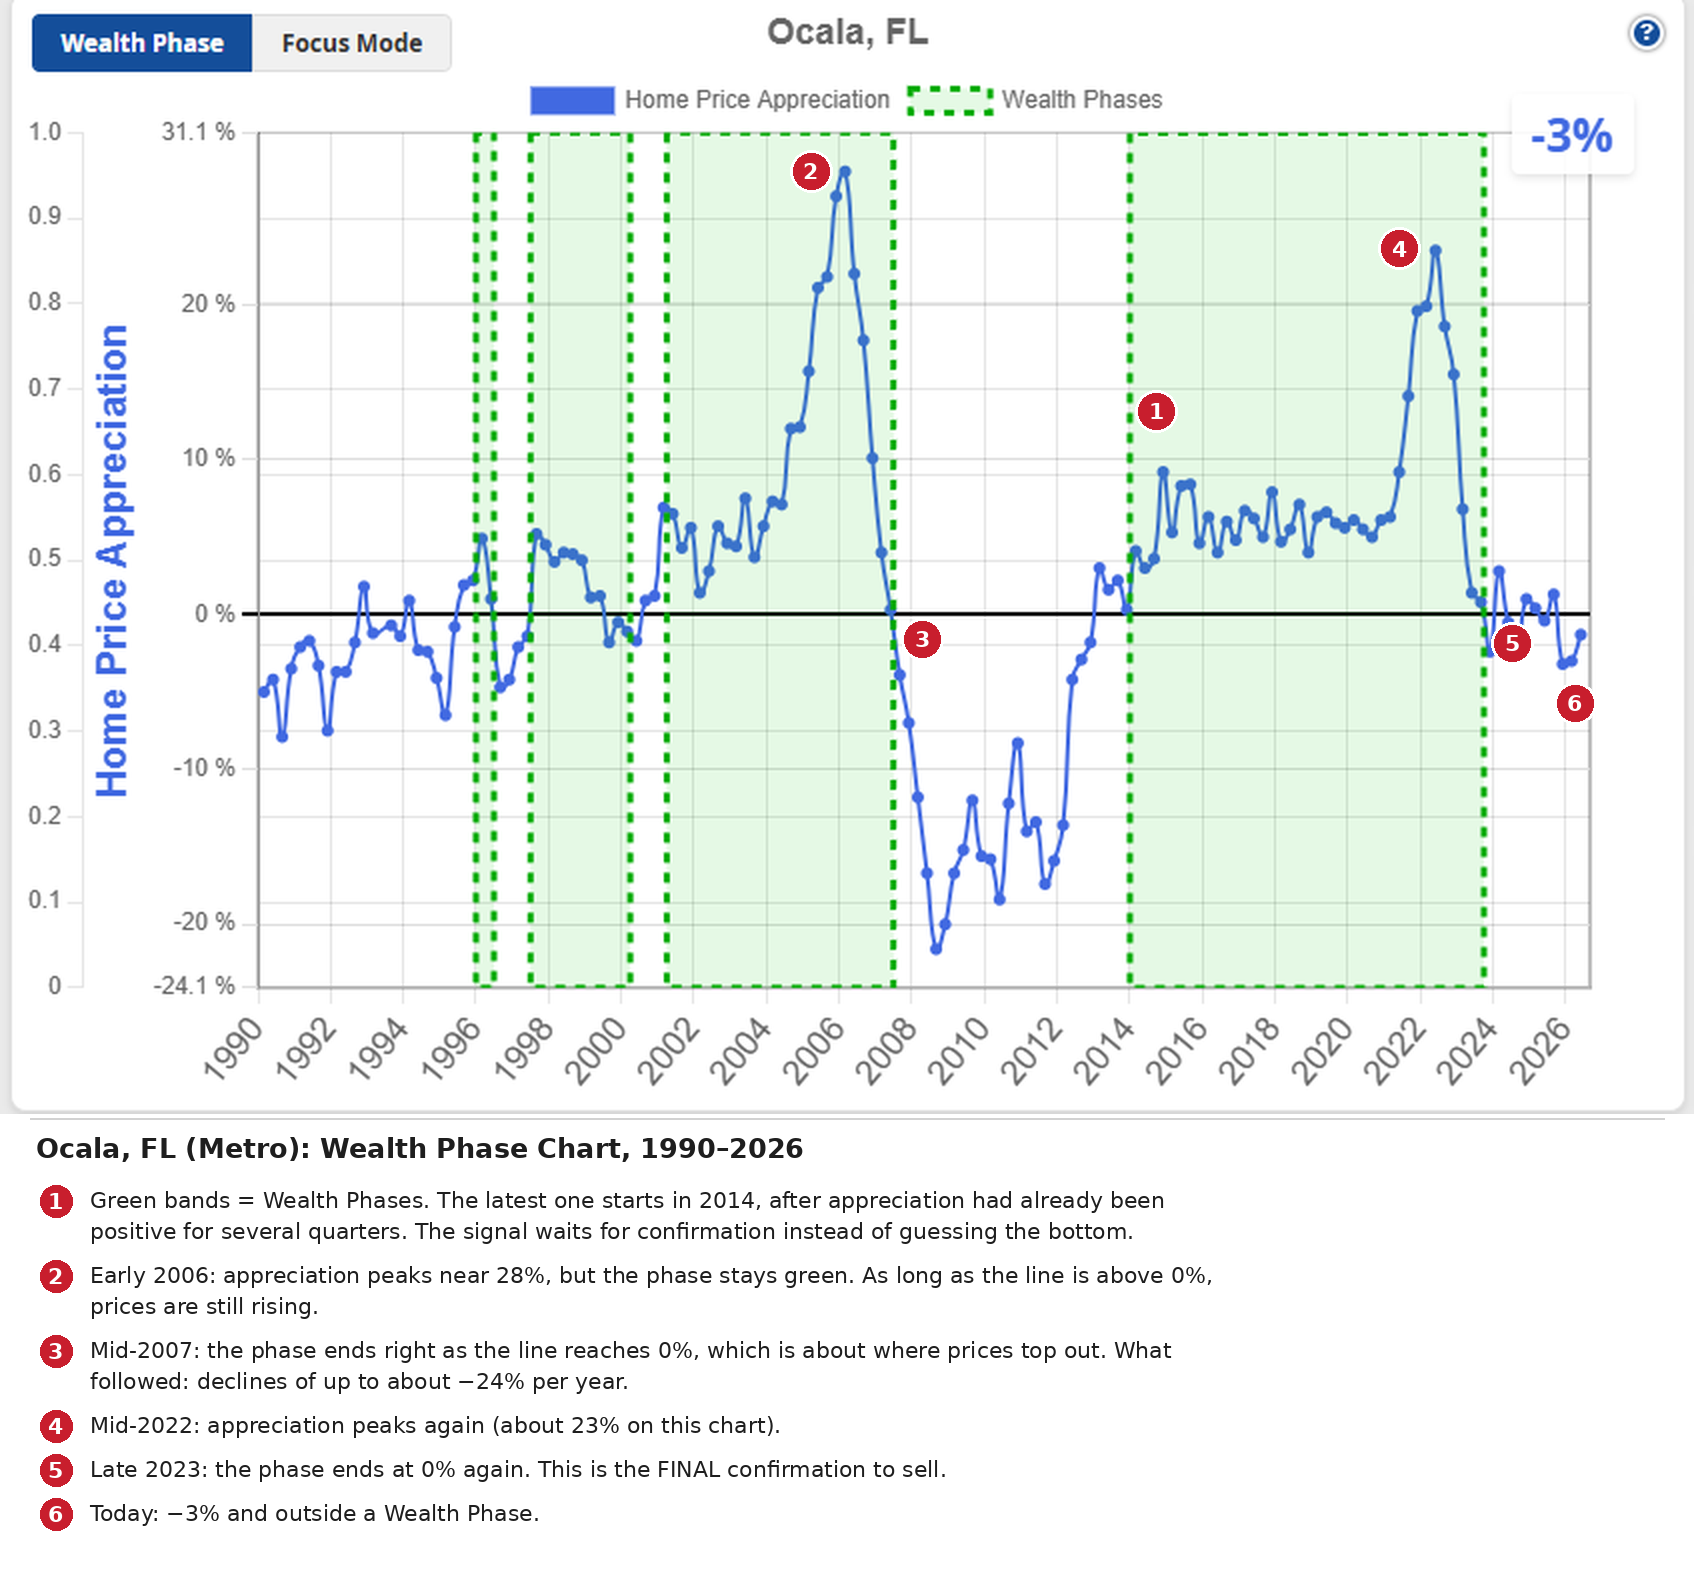
Ocala, FL (Metro): Wealth Phase chart, 1990–2026. Green bands = Wealth Phases.
Look at what Ocala did:
- 2006 (marker 2): appreciation peaked near 28%, but the Wealth Phase stayed green. Prices were still climbing.
- Mid-2007 (marker 3): the phase ended right as the line hit 0%, which is about where prices topped out. What came next was a decline of up to about ?24% per year.
- Mid-2022 (marker 4): another peak, about 23% on this chart.
- Late 2023 (marker 5): the phase ended at 0% again.
Notice the start of the latest phase too (marker 1). It didn’t turn green at the first uptick. It waited until appreciation had been positive for several quarters in 2013 and turned green in 2014.
That’s by design. The Wealth Phase is a confirmation signal:
- It confirms a new up-cycle before you commit capital.
- The end of a Wealth Phase is the “FINAL” confirmation to sell.
Trying to catch the exact bottom is how plenty of investors jumped back into markets like Las Vegas way too early.
So if the Wealth Phase is the final confirmation…
…where’s the early warning?
Part 2: Focus Mode, the Market Outlook vs. appreciation
Click Focus Mode on any Smart Market Report. You’ll see two lines:
- Green: home price appreciation (what has happened).
- Orange: the Market Outlook Score (what’s likely to happen next).
The Market Outlook is our forward-looking read, looking roughly a year ahead. Here’s how to read the score:
- Below 30: new or continued weakness.
- 30–70: if stable, more of the same. Trending up may mean an improving market; trending down, a weakening one.
- Above 70: a strong or strengthening market.
Now watch what it did in Ocala.
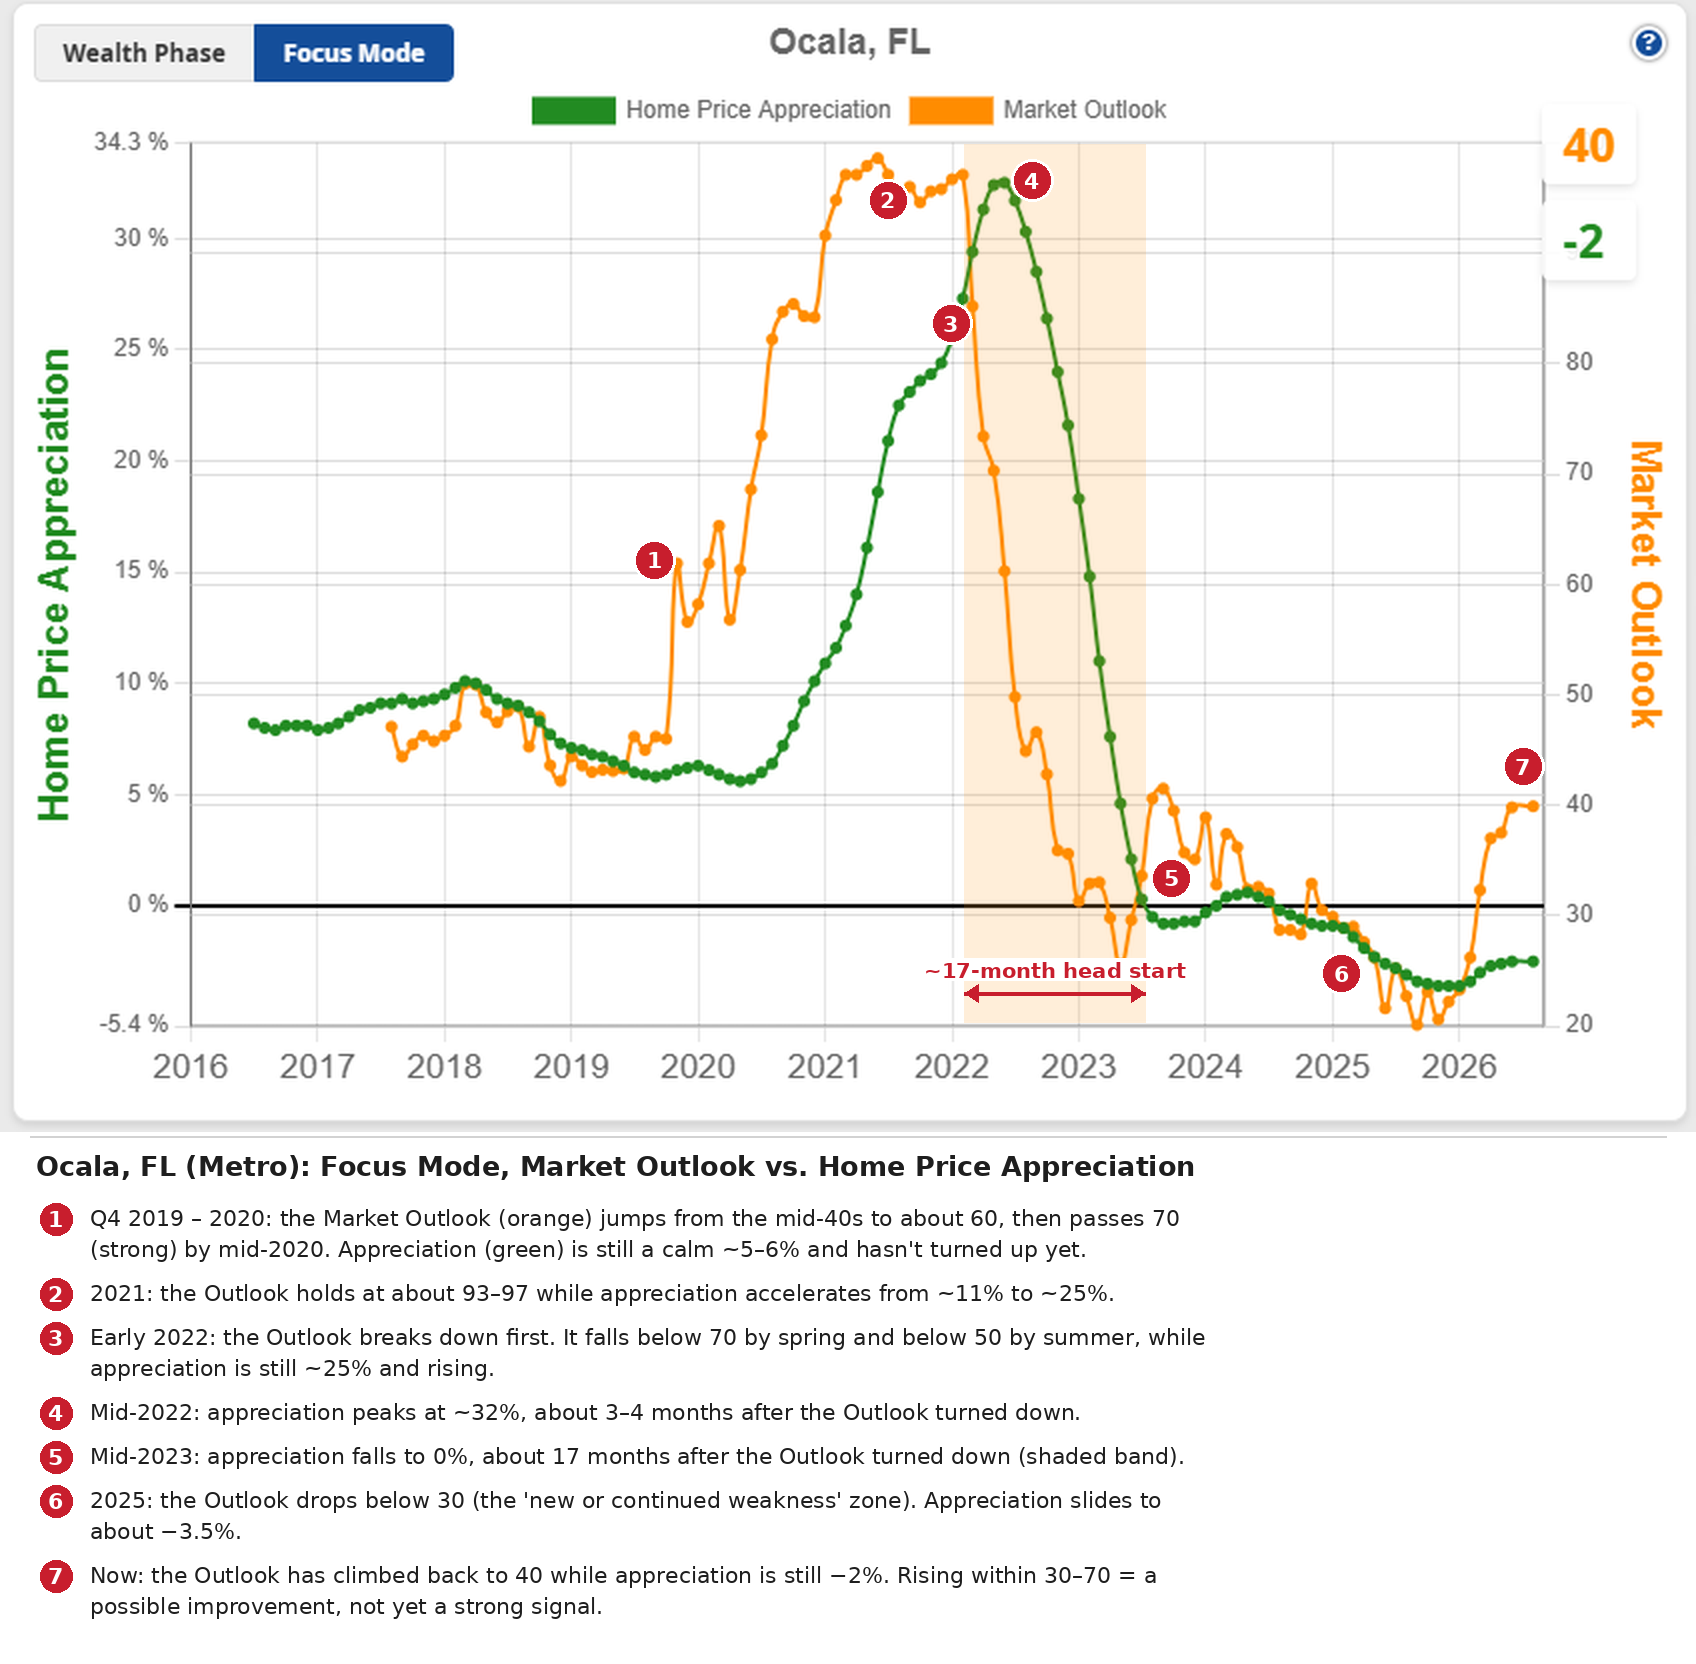
Ocala, FL (Metro): Market Outlook (orange) vs. Home Price Appreciation (green), 2016–2026.
On the way up
- Late 2019 (marker 1): the Outlook jumped from the mid-40s to about 60, and it passed 70 by mid-2020.
- At the same time: appreciation was a calm 5–6%. Nothing about Ocala looked “hot” yet.
- 2021 (marker 2): the Outlook held at about 93–97 while appreciation climbed from ~11% to ~25%.
The Outlook turned up first. Appreciation followed.
On the way down
This is the part that matters most if you own property.
- Early 2022 (marker 3): the Outlook broke down, falling below 70 by spring and below 50 by summer.
- At the same time: appreciation was still about 25% and rising.
- Mid-2022 (marker 4): appreciation peaked at about 32%. That’s 3–4 months after the Outlook turned.
- Mid-2023 (marker 5): appreciation hit 0%, about 17 months after the Outlook turned down.
- Late 2023: the Wealth Phase ended (the final confirmation from Part 1).
That’s your early warning.
Real estate markets tend to go up the stairs and down the elevator. If you were watching the Outlook in early 2022, you had well over a year to act, and you’d be selling into a market that was still appreciating fast. Buyers were plentiful and deals were easy to close.
That’s time to:
- Let leases run out or get tenants out,
- List at full retail into a strong market,
- And move your equity to the next emerging market.
The part nobody talks about: after the drop
- 2025 (marker 6): the Outlook fell below 30, the weakness zone. Appreciation slid to about ?3.5%.
- Today (marker 7): the Outlook has climbed back to 40 while appreciation is still ?2%.
In technical analysis terms, this is a positive divergence: the forward-looking line is rising while the backward-looking line is still negative. It’s the same pattern Ocala showed in late 2019, just earlier in the process.
Part 3: The second warning, S.T.A.R. momentum
The Market Outlook wasn’t the only tool flashing yellow. Open Advanced Mode on the Smart Market Report and you’ll find the S.T.A.R. (Six Trigger Alert Report) momentum grid.
Think of it as a traffic signal for a market’s energy:
- Green: positive, upward momentum.
- Red: negative, declining momentum.
- Yellow: that trigger changed direction this period.
The six triggers run from short-term on the left to long-term on the right. Short-term triggers flip often and carry less weight. Long-term triggers change slowly but matter most.
Here’s the key: every trend reversal, up or down, begins with the short-term triggers. When the color change “grows” from left to right, a major cycle change is usually underway.
Tip: the grid shows the last five quarters by default. Change Number of periods to 25 to see the whole cycle, like the view below.
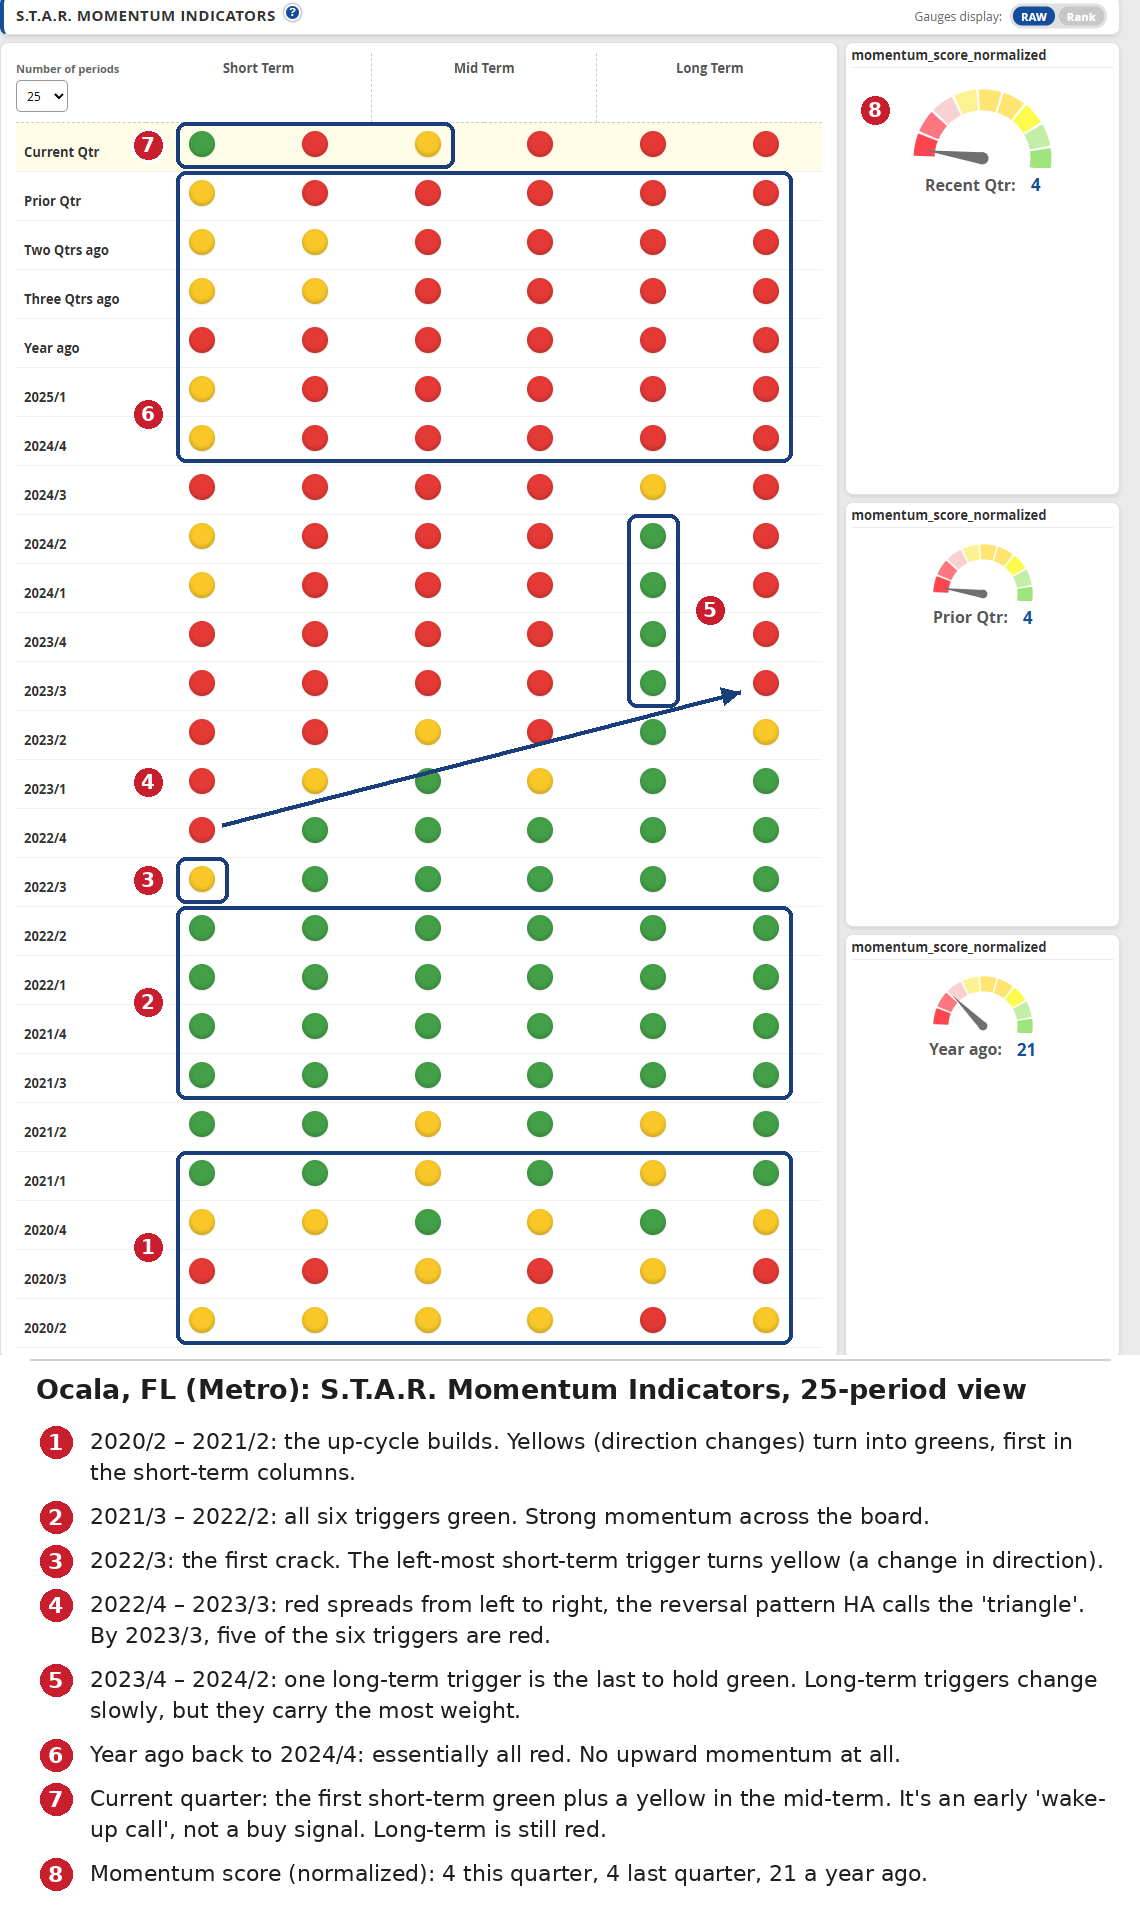
Ocala, FL (Metro): S.T.A.R. Momentum Indicators, 2020/2 through the current quarter (read from the bottom up).
Read it from the bottom up, and you’ll see the whole Ocala cycle:
- 2020 – early 2021 (marker 1): yellows turn into greens. The up-cycle is building.
- 2021/3 – 2022/2 (marker 2): all six triggers are green.
- 2022/3 (marker 3): the first crack. The left-most short-term trigger turns yellow, just after appreciation peaked.
- 2022/4 – 2023/3 (marker 4): red spreads from left to right. By 2023/3, five of the six triggers are red.
- 2023/4 – 2024/2 (marker 5): one long-term trigger is the last to hold green.
- 2024/4 – a year ago (marker 6): essentially all red.
From that first yellow (2022/3) to the end of the Wealth Phase (late 2023) was about five quarters. That fits what we’ve always said about S.T.A.R.: it can give a year or more of advance warning of a reversal.
Put the warnings in order
Line up the Ocala signals and you can see how the early warnings stack up ahead of the final confirmation:
- Early 2022: Market Outlook breaks down while appreciation is still ~25% and rising. (Early warning)
- Mid-2022: appreciation peaks at ~32%. (What happened)
- 2022/3: first S.T.A.R. short-term trigger turns yellow. (Early warning)
- 2022/4 – 2023/3: S.T.A.R. red spreads left to right. (Confirming the turn)
- Mid-2023: appreciation hits 0% and prices stop rising. (What happened)
- Late 2023: Wealth Phase ends. (FINAL confirmation)
Part 4: Strength and recent appreciation, T.A.P.S. and THAR
S.T.A.R. tells you the direction. Two more gauges in Advanced Mode tell you the rest:
- T.A.P.S. (Technical Analysis Point Score): the market’s underlying strength, built from dozens of technical analysis studies. T.A.P.S. Local looks at the market by itself and ignores any state, regional or national influence.
- 1-Yr THAR (Total Home Appreciation Rate) Rank: how the market’s raw home appreciation over the past year ranks against all other markets. A 90 means it beat 90% of them.
S.T.A.R. and T.A.P.S. are independent, and they don’t always agree. That’s exactly why you read them together: strength and momentum.
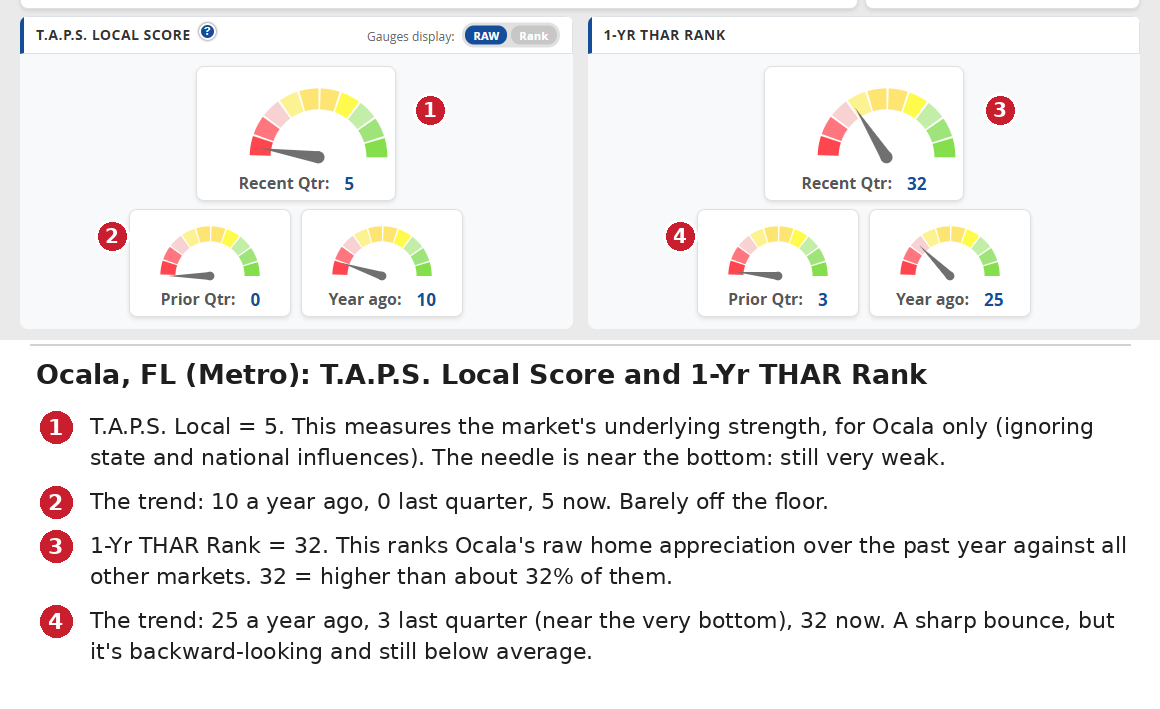
Ocala, FL (Metro): T.A.P.S. Local Score and 1-Yr THAR Rank, recent quarter vs. prior quarter vs. a year ago.
- T.A.P.S. Local (markers 1–2): 5 now, 0 last quarter, 10 a year ago. The needle is near the bottom of the gauge. Ocala’s underlying strength is still very weak.
- 1-Yr THAR Rank (markers 3–4): 32 now, up from 3 last quarter and 25 a year ago. Ocala’s past-year appreciation now beats about a third of all markets. It’s a sharp bounce, but it’s still below average.
Keep in mind that THAR is a rear-view mirror. It tells you what appreciation has done. That’s why it’s near the bottom of the list when you’re deciding whether to enter a market.
Part 5: So is Ocala a buy today?
Not yet. This is where you check the whole Smart Market Report, not one number.
The rough order of importance when entering a market:
- Wealth Phase
- Market Outlook
- S.T.A.R. momentum
- T.A.P.S. Combined
- T.A.P.S. Local
- 1-Yr THAR
- 4-Yr THAR
To start a new investment, you want the long-term S.T.A.R. triggers all green, T.A.P.S. showing strong (or close to it), and the market in a green Wealth Phase.
Here’s Ocala right now:
- Wealth Phase: not in one. Not confirmed.
- Market Outlook: 40, rising from the low 20s. Improving, but not strong (above 70).
- S.T.A.R. momentum: first short-term green, one mid-term yellow, long-term all red. A “wake-up call” only.
- Momentum score: 4 (prior quarter 4, a year ago 21). Very weak.
- T.A.P.S. Local: 5 (prior quarter 0, a year ago 10). Very weak.
- 1-Yr THAR rank: 32 (prior quarter 3, a year ago 25). Bouncing from a low base.
- Wholesale-Flip Score: 44, CAUTION (37 last quarter, 29 a year ago). Rising.
- Cash Flow Boost Score: 61, PASS. Decent cash-flow suitability.
On that new short-term green: treat it as a wake-up call to pay closer attention. If it’s more than noise, it will work its way into the intermediate and long-term triggers, just like the red did in 2022 and 2023, only in reverse.
Bottom line: Ocala is a watch-list market, not an entry. If the Outlook keeps climbing, S.T.A.R. turns greener from left to right, T.A.P.S. strengthens and a new Wealth Phase starts, it becomes a very different conversation.
A quick word on cash flow
Ocala passes the Cash Flow Boost screen today. That’s the trap many investors fall into:
“The cash flow is real. But when a local market is quietly weakening underneath you, property values erode over time. You’re getting cash in one hand while losing equity in the other.”
High-cash-flow markets are usually weak or flat markets. They cash flow because they haven’t appreciated much.
The rare exceptions are markets that were weak or flat and are just starting a new up-cycle. For a short window they offer both cash flow and appreciation. To find them:
- Put the Cash Flow Boost Score and the Market Outlook Score side by side in The Table.
- Look for markets strong on both.
- Then run your own numbers on actual properties. Your loan terms, taxes and insurance are what decide your real cash flow.
A quick word on the $20,000 examples in our videos
Several people have asked about the assumptions behind the “turn $20,000 into millions” examples. Here they are:
- 15–20% down (an 85% loan-to-value mortgage), not 10:1 leverage.
- Full retail price on an average property. No discounts, no added value.
- Rents assumed to cover all costs, so cash flow breaks even.
- Actual appreciation for each market over that period, adjusted for inflation.
The same assumptions are used for both “buy and hold” and “timing the cycle,” so the only difference is when you’re in the market.
If your market forces a bigger down payment today, you have less leverage, so the dollar results will be smaller. The main idea still holds: most real estate wealth comes from leveraged appreciation, and the biggest mistake is giving it back in a down cycle.
Keep this in perspective
- Nothing truly predicts the future. Technical analysis is how the world’s biggest traders try. Real estate is far more predictable than stocks because local cycles move like a slow train.
- This is one market and one cycle. Ocala is an illustration, not a guarantee. Go look at any market’s chart at a past point in time and compare the signal to what happened next.
- Allow for the data lag. Our data updates quarterly, about 55 days after each quarter ends. So the real-world head start in Ocala was closer to 15 months than 17. That’s still plenty of time.
- Any single reading can bounce. Look at the Outlook in late 2023: a short bump that faded. Short-term S.T.A.R. triggers flip often too. That’s why you confirm with S.T.A.R., T.A.P.S. and the Wealth Phase instead of acting on one number.
How to do this for your own markets
- Find: on the Map or The Table, look for markets where the Market Outlook is rising.
- Check the cycle: open the Smart Market Report. Use the Wealth Phase chart for where are we? and Focus Mode for what’s likely next?
- Confirm: in Advanced Mode, look for S.T.A.R. greens growing from left to right and T.A.P.S. strengthening.
- If you already own there: watch for the Outlook rolling over and the first short-term S.T.A.R. triggers turning while appreciation is still strong. That’s your early warning. The end of the Wealth Phase is your final confirmation.
Buy when the cycle is confirmed. Get your warning a year early. Sell into strength, not weakness.
That’s the whole game.
Data: HousingAlerts Smart Market Report, Ocala, FL (Metro), captured September 2026. Values read from the charts are approximate. All data is provided “as is” for informational and educational purposes only and is not investment advice.